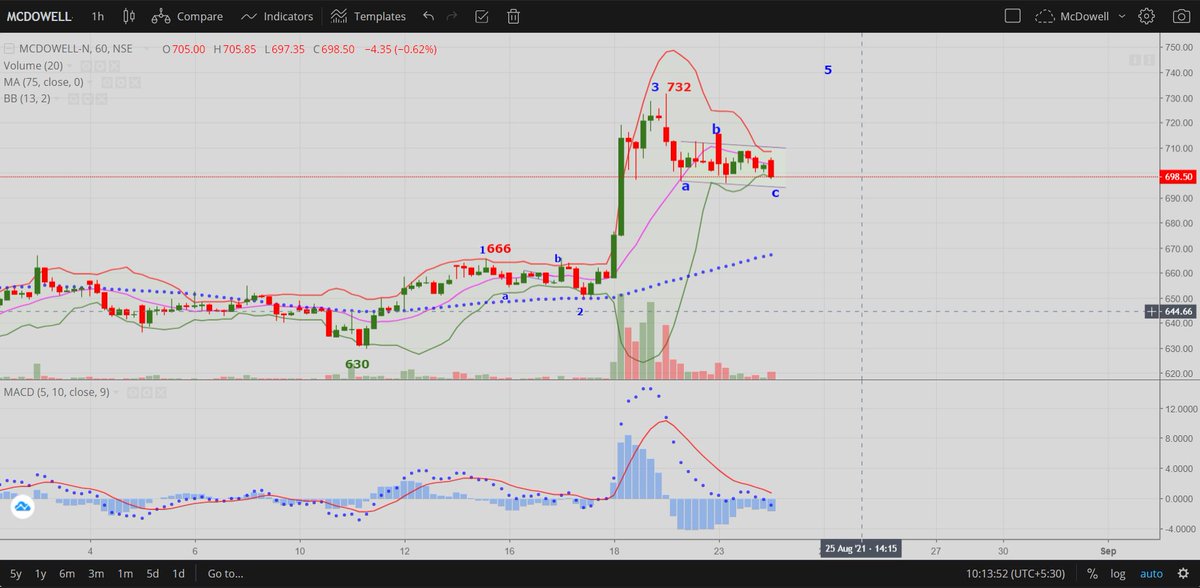
#MCDOWELL_N - United spirits gave a good breakout on weekly chart - TradingView -
More from TradingView India 🇮🇳
More from Mcdowell


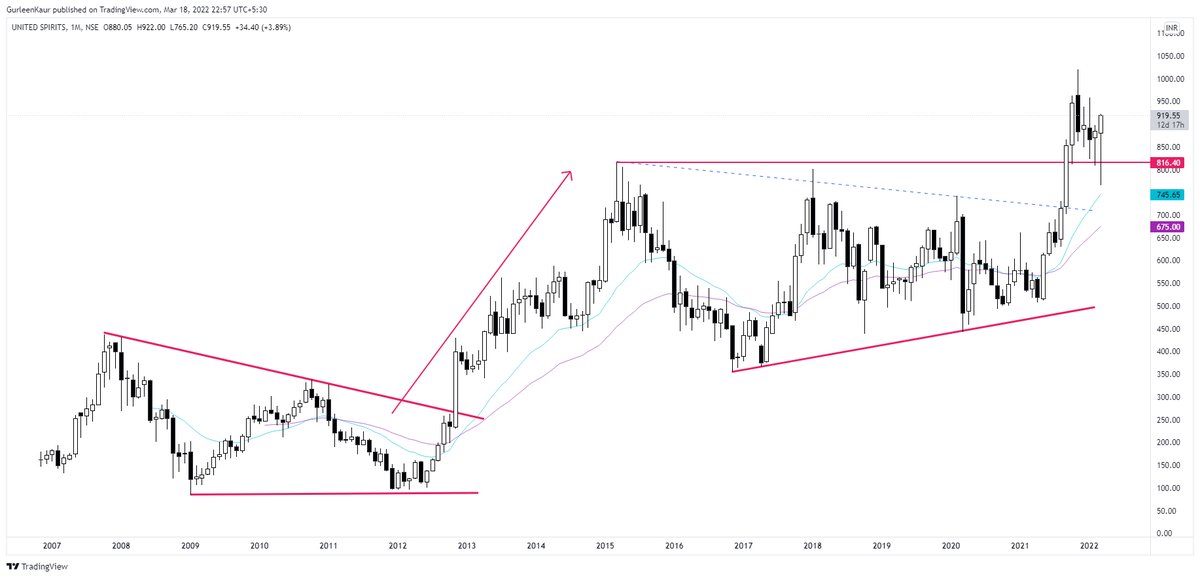

United Spirits - I love the stocks moving slowly than making a lot of noise and attracting too short-term noise traders.
A clean and clear chart posted in August.
Updated chart. https://t.co/HCnRuWvIpO
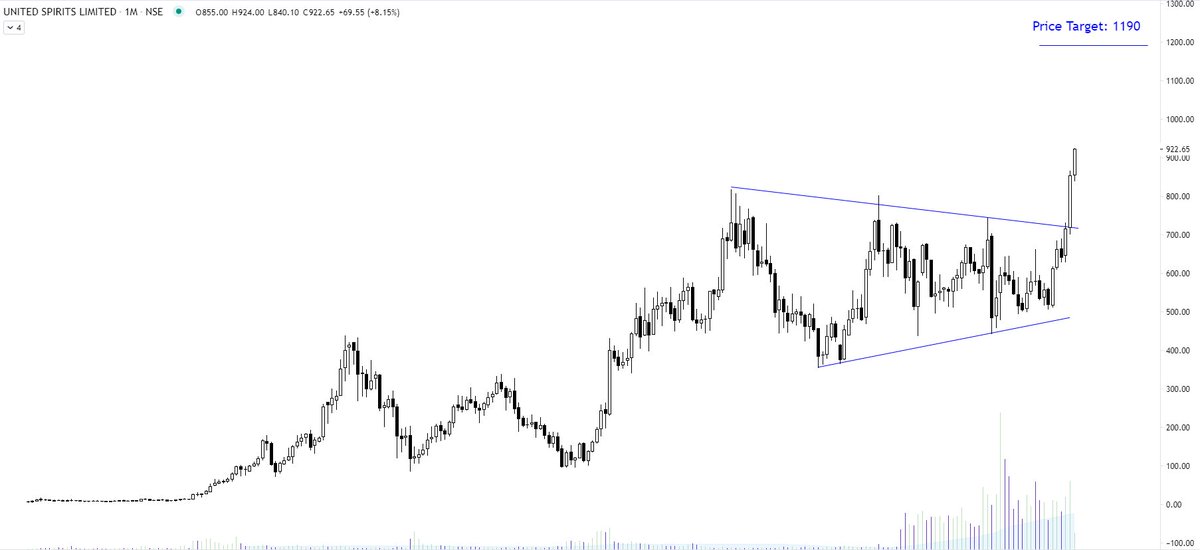
A clean and clear chart posted in August.
Updated chart. https://t.co/HCnRuWvIpO
United Spirits Ltd - Monthly Log Scale \U0001f37b pic.twitter.com/kj7jXr8moE
— The_Chartist \U0001f4c8 (@nison_steve) August 18, 2021