⬇️⬇️⬇️ The "Math" of Fear
As it is Thursday, I have a post for you today in anticipation of Gov. DeWine's new Maps of Fear which he has tried to phase in. I have previously discussed both the new red and blue maps and their issues -
The first is a hyper-simplistic (and unrealistic) but illustrative example of the calculations that the new blue map goes through to arrive at its numbers.
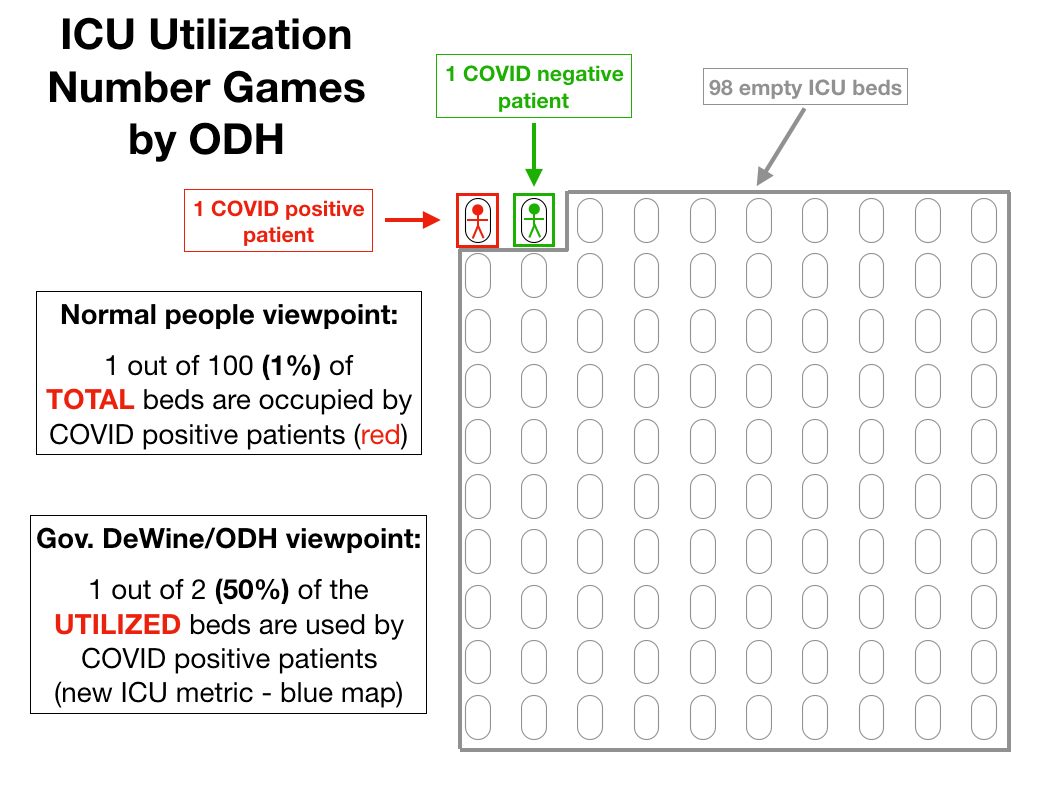
But that's not how Gov. DeWine would present this situation to us. Instead of looking at the total available beds, they look only at the beds in use.
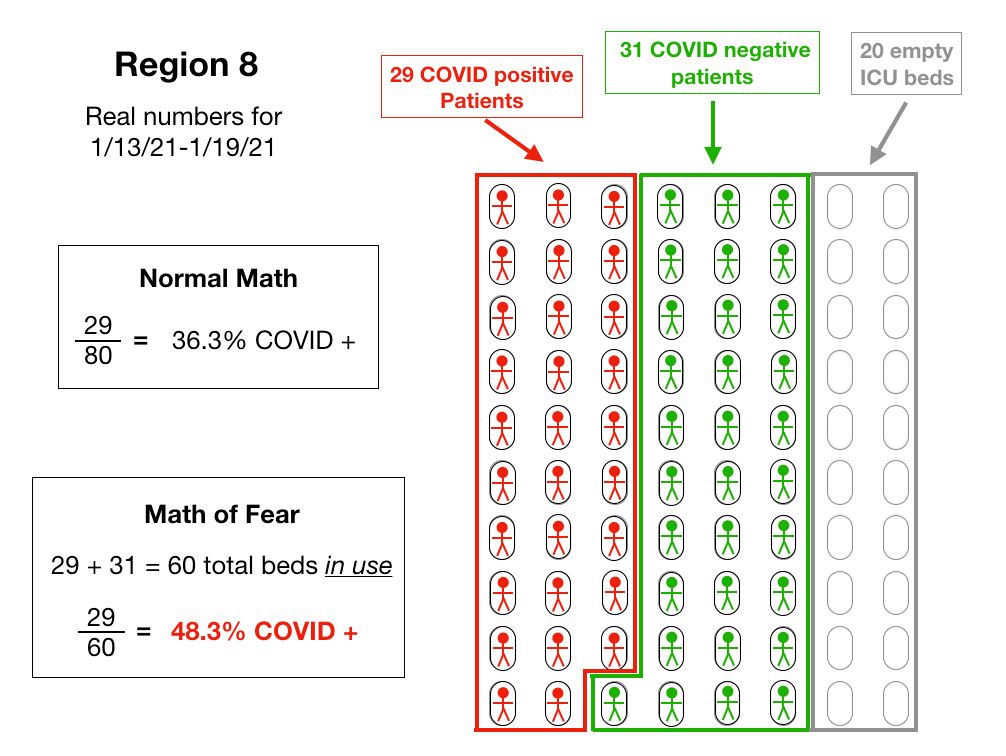
By manipulating the numbers, they have increased the real percentage by a third.
More from Maths

It is trying when mathematicians declare condescendingly that there is no point doing things because their models tell them so. Well maybe some of the assumptions don't hold up. How did that work out for the no additional risk from large events and no point in border controls...
During wave 1 cases fell very fast, faster than I think most people were expecting. Particularly in Scotland. Rt was probably ~0.5 until we started easing off.
This was despite a constant leak of cases coming out of hospitals and LTC facilities as we were rationing PPE and are policies were nowhere near ideal. There was insistence from infection control that droplet protections were sufficient. We have all learned a lot since then.
Not to mention we have learned to avoid the shit show of actively importing cases into care homes. We've learned not to repeat that. Other sectors have learned too.
We've learned a lot and there's no reason we can't control this new variant. But we will not manage if we don't try and act with clarity of purpose.
Oh for crying out loud. I don't know anyone who thinks we can get R below 0.9 with this new variant. It's 22 virus generations to even get from 50,000 cases to 5,000 at R=0.9 - that's 4 months. TTI is a complete fantasy right now: spend the money on the vaccine rollout. https://t.co/MyeBt8tC1w
— Oliver Johnson (@BristOliver) January 3, 2021
During wave 1 cases fell very fast, faster than I think most people were expecting. Particularly in Scotland. Rt was probably ~0.5 until we started easing off.
This was despite a constant leak of cases coming out of hospitals and LTC facilities as we were rationing PPE and are policies were nowhere near ideal. There was insistence from infection control that droplet protections were sufficient. We have all learned a lot since then.
Not to mention we have learned to avoid the shit show of actively importing cases into care homes. We've learned not to repeat that. Other sectors have learned too.
We've learned a lot and there's no reason we can't control this new variant. But we will not manage if we don't try and act with clarity of purpose.


OK, I may be guilty of a DoS attack attempt on mathematicians' brains here, so lest anyone waste too much precious brain time decoding this deliberately cryptic statement, let me do it for you. •1/15
First, as some asked, it is to be parenthesized as: “∀x.∀y.((∀z.((z∈x) ⇒ (((∀t.((t∈x) ⇒ ((t∈z) ⇒ (t∈y))))) ⇒ (z∈y)))) ⇒ (∀z.((z∈x) ⇒ (z∈y))))” (the convention is that ‘⇒’ is right-associative: “P⇒Q⇒R” means “P⇒(Q⇒R)”), but this doesn't clarify much. •2/15
Maybe we can make it a tad less abstruse by using guarded quantifiers (“∀u∈x.(…)” stands for “∀u.((u∈x)⇒(…))”): it is then “∀x.∀y.((∀z∈x.(((∀t∈x.((t∈z) ⇒ (t∈y)))) ⇒ (z∈y))) ⇒ (∀z∈x.(z∈y)))”. •3/15
Maybe a tad clearer again by writing “P(u)” for “u∈y” and leaving out the quantifier on y, viꝫ: “∀x.((∀z∈x.(((∀t∈x.((t∈z) ⇒ P(t)))) ⇒ P(z))) ⇒ (∀z∈x.P(z)))” [✯]. Now it appears as an induction principle: namely, … •4/15
… “in order to prove P(z) for all z∈x, we can assume, when proving P(z), that P(t) is already known for all t∈z∩x” (n.b.: “(∀z.(Q(z)⇒P(z)))⇒(∀z.P(z))” can be read “in order to prove P(z) for all z, we can assume Q(z) known when proving P(z)”). •5/15
\u2200x.\u2200y.((\u2200z.((z\u2208x) \u21d2 ((\u2200t.((t\u2208x) \u21d2 (t\u2208z) \u21d2 (t\u2208y)))) \u21d2 (z\u2208y))) \u21d2 (\u2200z.((z\u2208x) \u21d2 (z\u2208y))))
— Gro-Tsen (@gro_tsen) February 12, 2021
First, as some asked, it is to be parenthesized as: “∀x.∀y.((∀z.((z∈x) ⇒ (((∀t.((t∈x) ⇒ ((t∈z) ⇒ (t∈y))))) ⇒ (z∈y)))) ⇒ (∀z.((z∈x) ⇒ (z∈y))))” (the convention is that ‘⇒’ is right-associative: “P⇒Q⇒R” means “P⇒(Q⇒R)”), but this doesn't clarify much. •2/15
Maybe we can make it a tad less abstruse by using guarded quantifiers (“∀u∈x.(…)” stands for “∀u.((u∈x)⇒(…))”): it is then “∀x.∀y.((∀z∈x.(((∀t∈x.((t∈z) ⇒ (t∈y)))) ⇒ (z∈y))) ⇒ (∀z∈x.(z∈y)))”. •3/15
Maybe a tad clearer again by writing “P(u)” for “u∈y” and leaving out the quantifier on y, viꝫ: “∀x.((∀z∈x.(((∀t∈x.((t∈z) ⇒ P(t)))) ⇒ P(z))) ⇒ (∀z∈x.P(z)))” [✯]. Now it appears as an induction principle: namely, … •4/15
… “in order to prove P(z) for all z∈x, we can assume, when proving P(z), that P(t) is already known for all t∈z∩x” (n.b.: “(∀z.(Q(z)⇒P(z)))⇒(∀z.P(z))” can be read “in order to prove P(z) for all z, we can assume Q(z) known when proving P(z)”). •5/15