First interview of Hiral Chandrana
#MASTEK
Adding 40+ customers every quarter from an year
650+ active clients
Met 150+ customers/partners virtually in last 40days
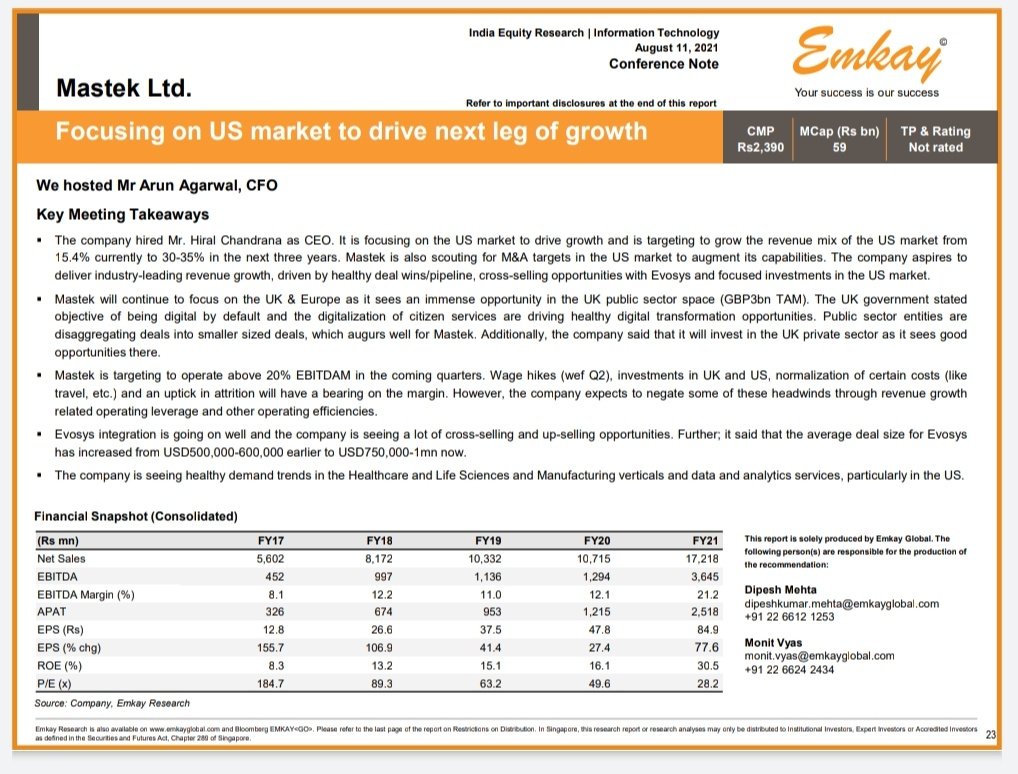
Focus to accelerate US growth-have strategy in place
960cr cash on books
Looking for organic+inorganic growth
#CNBCTV18Exclusive | Catch @_anujsinghal, @_soniashenoy & @SurabhiUpadhyay in conversation with @HiralChandrana who was appointed as global CEO of #Mastek last month. He says that a big part of their strategy is to grow in the US. @Reematendulkar pic.twitter.com/nRnfGoGHTp
— CNBC-TV18 (@CNBCTV18News) August 18, 2021
More from Shreenidhi P
More from Mastek

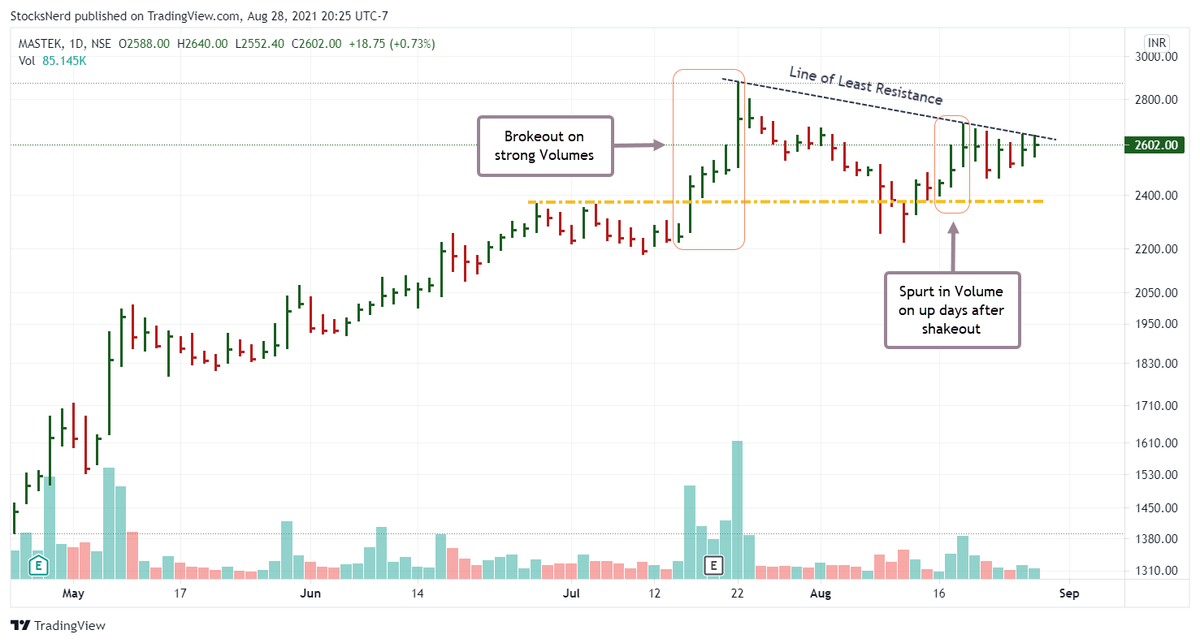
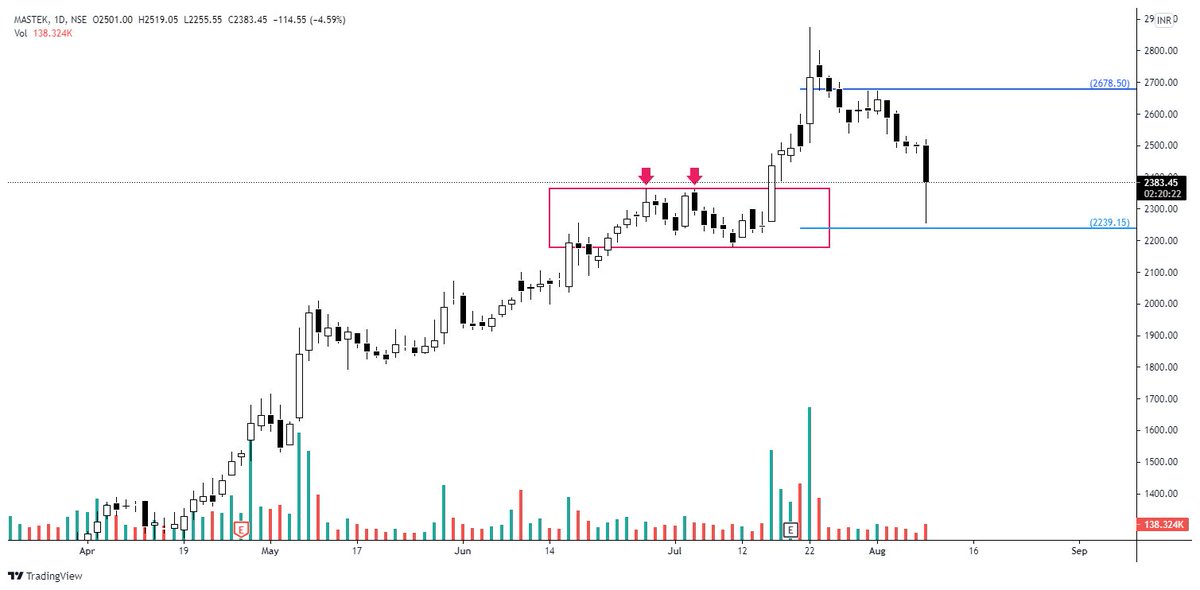
#MASTEK Update
TSL hit 📉
Though at CMP; Time to stack in 📈 for targets of 2620 followed by 2720.
#StockMarket https://t.co/IHHpv2bU2w
TSL hit 📉
Though at CMP; Time to stack in 📈 for targets of 2620 followed by 2720.
#StockMarket https://t.co/IHHpv2bU2w
#MASTEK Update
— Gurleen (@GurleenKaur_19) July 23, 2021
2800 Hit; 70% Booked and rest Holding for a target of 2900.
#StockMarket #StockToWatch https://t.co/gQTyzf4IUS pic.twitter.com/fp9hrZyv7d