Breadth will treat all stocks in an index equally. Stock with largest capitalization and the smallest are both equal in breadth analysis. It can be applied to any exchange or index of securities, any sector or industry group.
🧵Market Breadth 101
It is a broad approach to overall market analysis that helps traders to realize the underlying strength or weakness associated with a market move
Thanks @PradeepBonde for the blogpost & @iManasArora for making breadth tool in context of Indian Market
(1/n)
Breadth will treat all stocks in an index equally. Stock with largest capitalization and the smallest are both equal in breadth analysis. It can be applied to any exchange or index of securities, any sector or industry group.
One may consider it "oscillating indicator", when reached a threshold level, either positive or negative, they tend to reverse or take a halt.
It is concerned with probability that market is approaching a major turning point, so it isn't helpful knowing everyday trends.
Breadth is based on the price of the variables, still it can offer leading indications based upon the identification and use of previous levels or thresholds that are consistent with similar market action.
Breadth directly indicates/represents the market, no matter what the indices are doing.
Might look complex to understand it at sight. Let's try to break it down.
Link: https://t.co/nvEuNXoiZ7
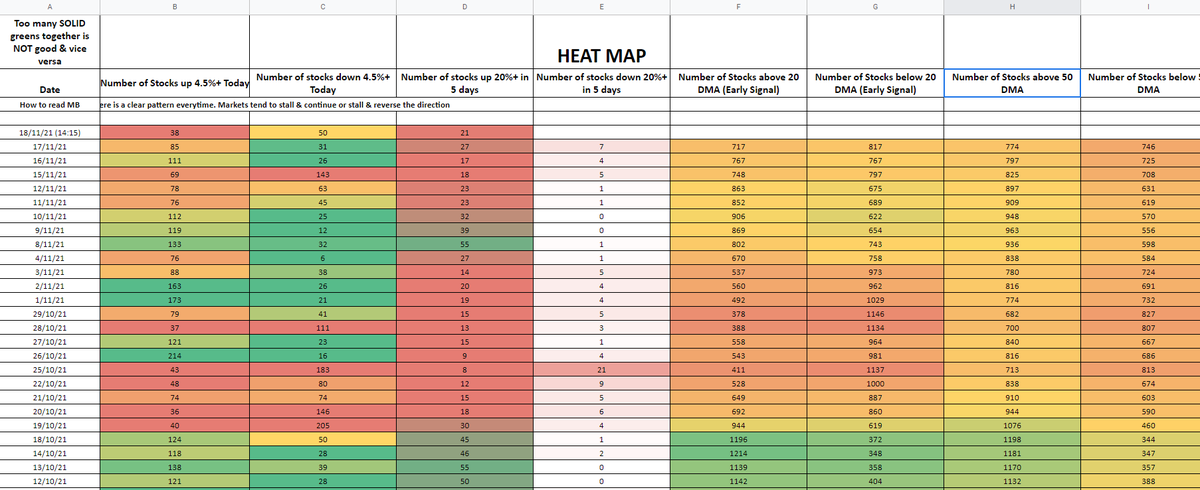
Possibilities:
(B+) + (C-) :: BULLISH (+ve)
(B-) + (C+) :: BEARISH (-ve)
(B-) + (C-) :: NEUTRAL (consolidation/indecisiveness/pause)
Same can be applied to other columns as well.
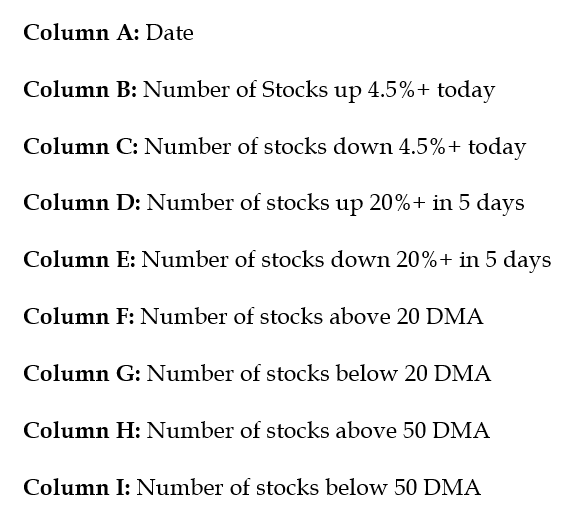
Continuous "BULLISH (+ve)" or "BEARISH (-ve)" reading indicates market running out of breath and a high possibility of a pause or reversal in the trend.
Pic: (Line from the sheet, answering how to read Market Breadth Sheet)

Case: Continuous bullish readings followed by a fall (03/08/20 - 28/08/20)
Note: Indices does not represents all stocks, Market Breadth does. For instance, there is a possibility that the number of breakouts are pretty high and you don't see a good jump in indices.
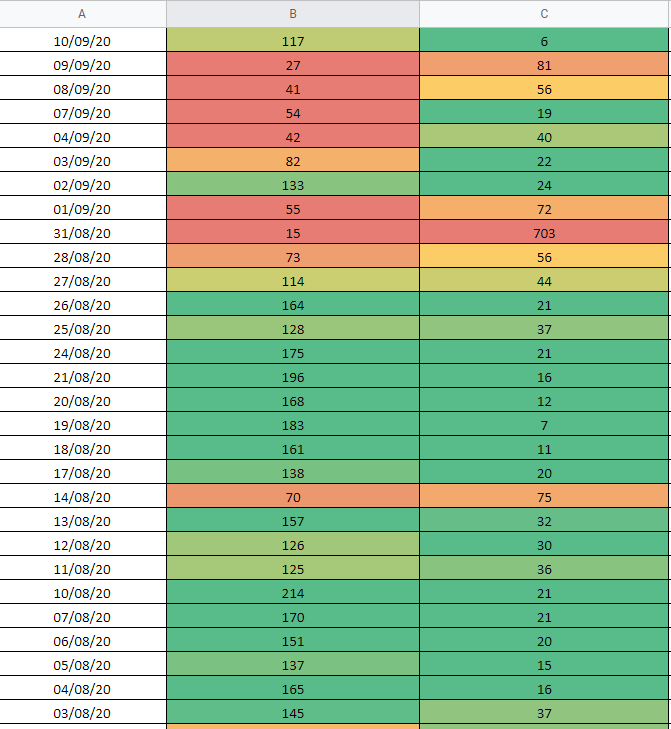
Case: Continuous bearish readings (17/09/20 - 24/09/20) followed by a bounce (25/09/20 & 28/09/20)

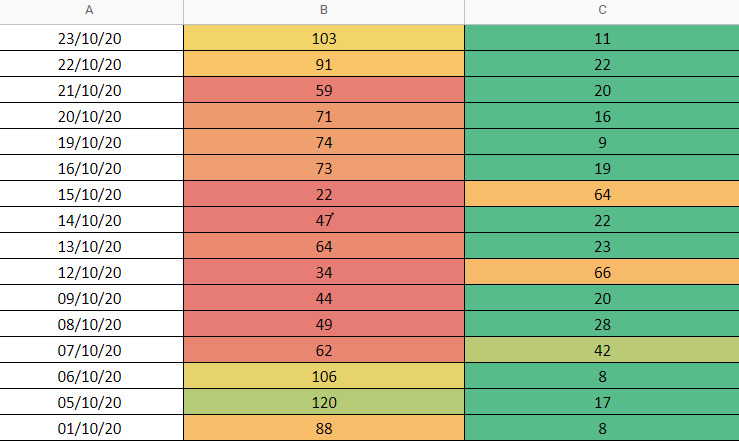
Case: Low readings in Column B indicating weak buying pressure in the market, yet no high readings in Column C. (01/10/20 - 15/10/20).
However, you might notice a rally in #NIFTY50 during this time, watching indices and making decision based on them has its negatives.
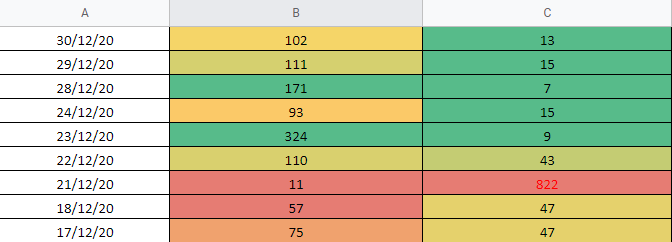
Case: "Extreme" bearish reading of just one day (21/12/20) followed by a bounce. It doesn't necessarily require a series of negative readings for a bounce. Same works vice-versa.
This was a rare negative reading, market ran out of breath the same day itself.
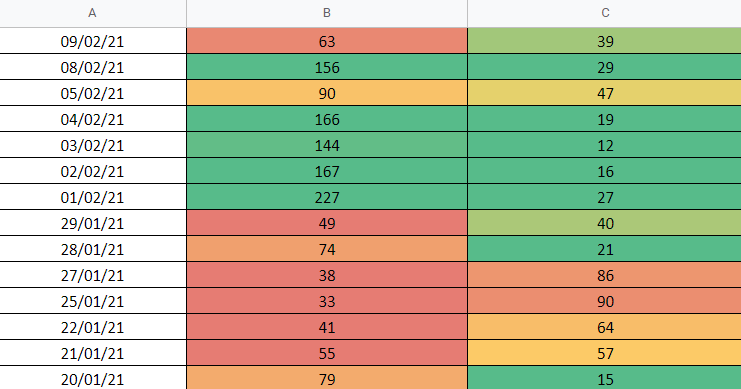
Case: Continuous selling pressure of 4-5 days (21/01/21 - 27/01/21), followed by a reversal (01/02/21 - 05/02/21)
When readings are more than usual limits for a long period of time, it hints "stretched market"
Jump in Column D: "Number of stocks up 20%+ in 5 days" indicates the possibility of a momentum. Market tends to reverse/pause when its close to extreme readings.
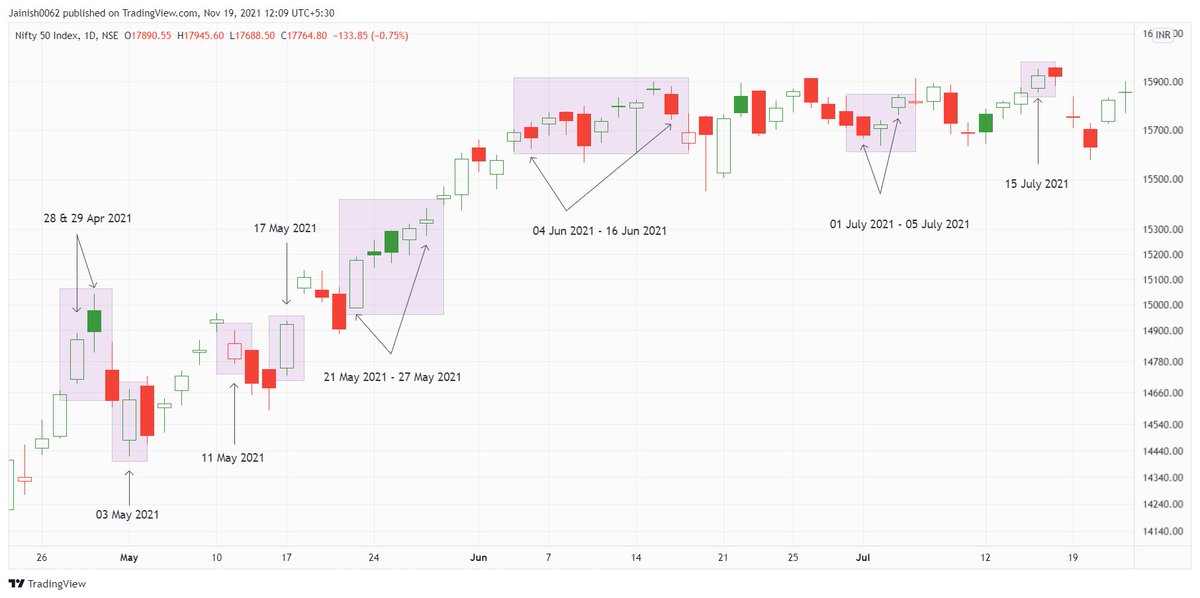
Column D faces a resistance around 55-60 readings, it kept breaching resistance readings in every few days. (27/04/21 to 15/07/21)
Numbers went over 100 on 08/06/21, we witnessed one of the strongest run in the market during this time.
August 2021 observed correction in market, selling exhaustion was visible twice during the month and gave a bounce in both instances.
Case I: Selling pressure (04/08/21 to 11/08/21), observed a small bounce/pause. However selling pressure was not visible in #NIFTY50
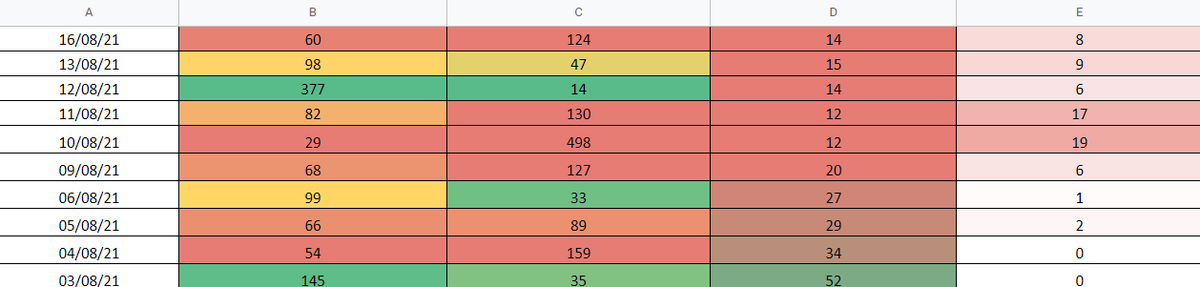
Case II: Market went weak again, selling continued for 4-5 days (16/08/21 - 23/08/21), bounced back stronger this time (24/08/21 - 02/09/21)
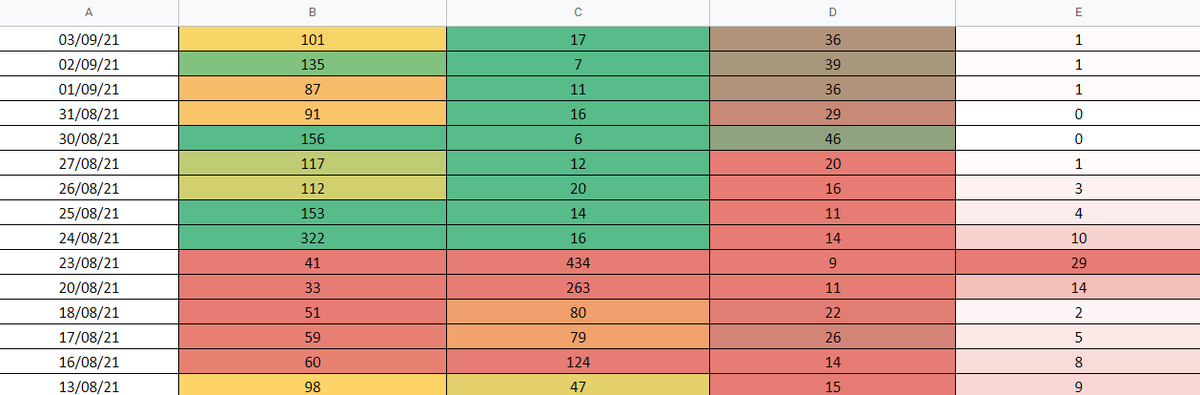
For more cases and recent examples (Oct & Nov 2021) check out Manas Sir's notes on side of the sheet. Other columns work the similar way, try to find the extreme readings and market behaviour near them.
Blogpost by @PradeepBonde -
Link: https://t.co/Gv3ZQlLfzx
Like & retweet if you found this helpful. It was an honest attempt to break down Market Breadth tool the way I understand.
"Market Breadth Indicators" by Gregory L Morris covers other market breadth tools in detail.
Thanks to @iManasArora Sir for bringing drastic improvement in my trading journey, can't thank you enough. You have shortened my learning curve by years. Always grateful🙌