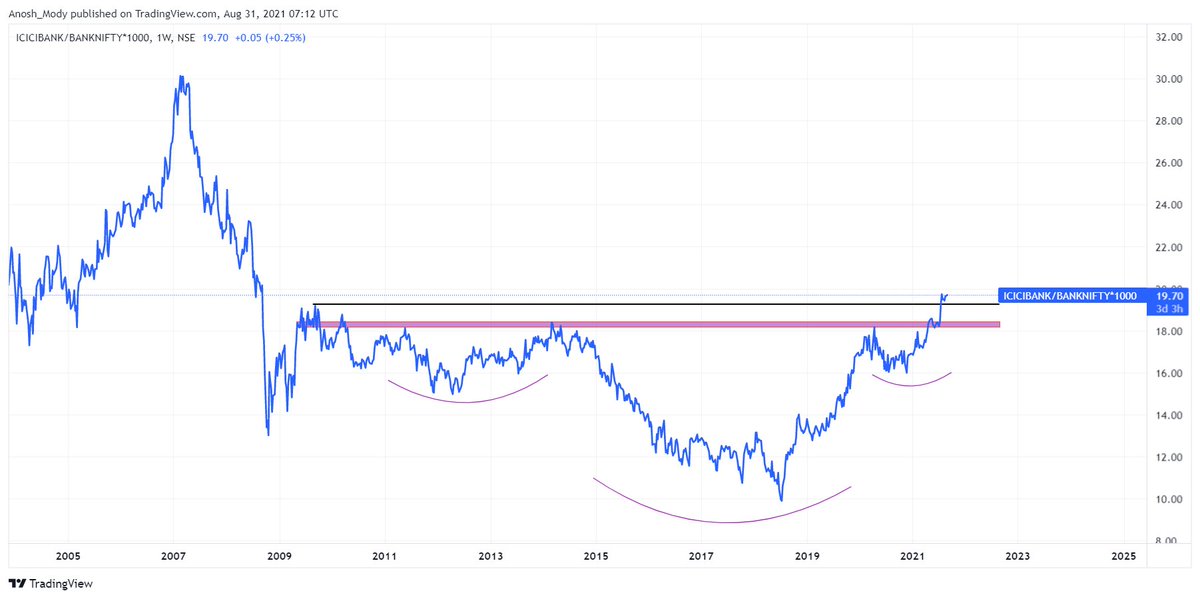
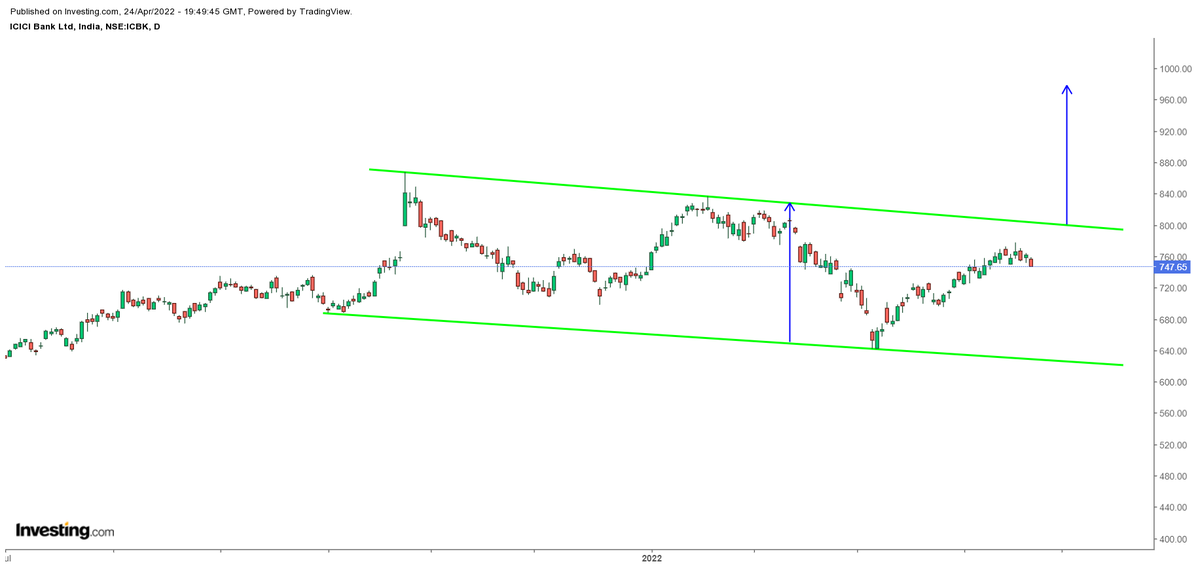
#ICICIBank -- Resistance at 800-805
Close/crossing above 836 opens doors for 4 digit target Rs.1000
More from Shivaji Vitthalrao🇮🇳
BEML
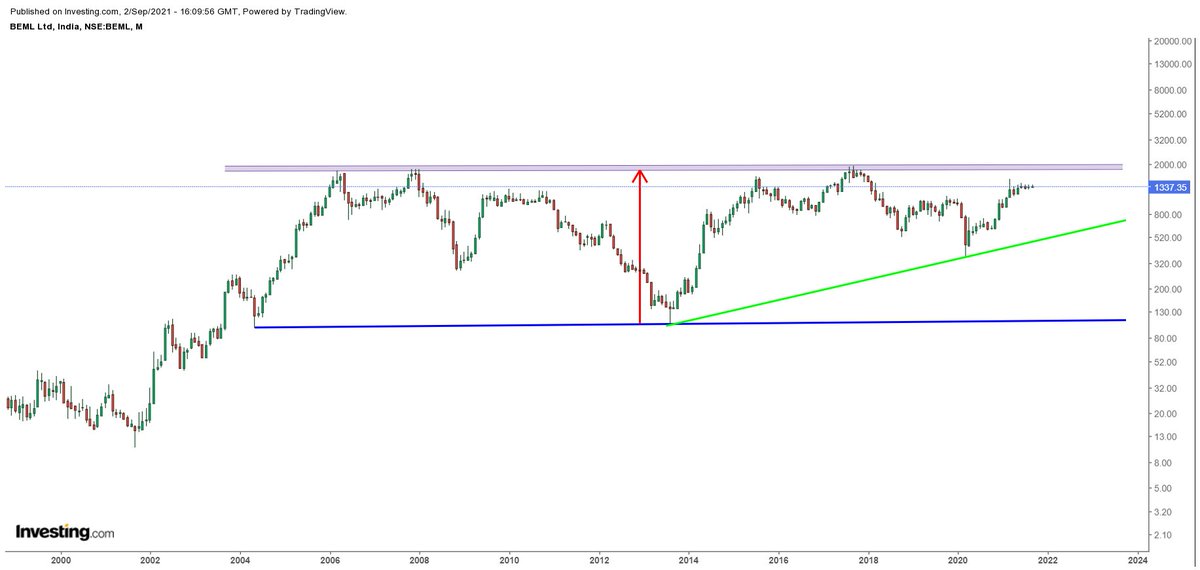
1. Stock is consolidating in the band 100-120 on lower side & 1900-1950 on upper side.
2. CMP 1344 1st targets 1850-1950
3. Medium term targets 2400-2500
4. Long term taregts 3500 first and then 8,000-10,000 in next 4-5 yrs
5. This is going to be 15-16 years breakout https://t.co/BXMv5GjsGW
6. Stock hits high 160-175 in 1995 & 1997
7. went into down trend, consolidated for 3 yrs 1999-2002
8. Gave breakout above 34 hinting at major shift in Feb 2002
9. Gave 1st multi year breakout in Oct 2003 above 160-175 which was failed
10. Next attempt in Sep 2004 crossed 175
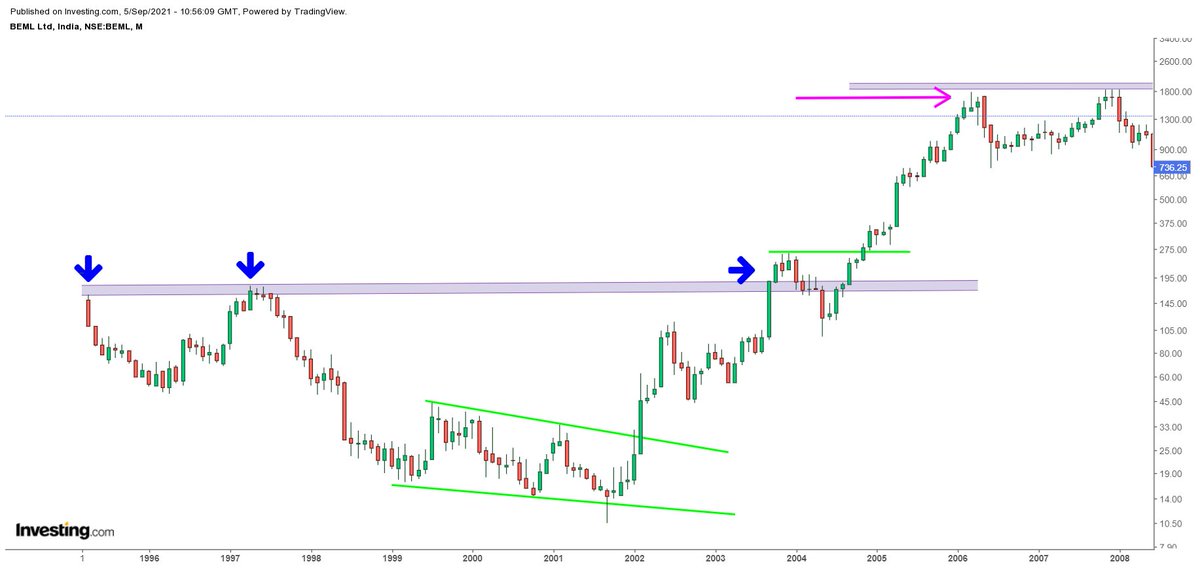
11. Above 1995-1997 highs (160-175) stock went on to become 10x in a matter of 20-22 months
12. CMP 1344 Multi year breakout will trigger above 1950 on weekly closing basis
13. Will be watching 1st breakout above 1950
14. SL 1260/1100 depends on risk of the trader or investor
1. Stock is consolidating in the band 100-120 on lower side & 1900-1950 on upper side.
2. CMP 1344 1st targets 1850-1950
3. Medium term targets 2400-2500
4. Long term taregts 3500 first and then 8,000-10,000 in next 4-5 yrs
5. This is going to be 15-16 years breakout https://t.co/BXMv5GjsGW
Spotted a stock which can become 5digits and 5x over 3-5 years
— Shivaji Vitthalrao\U0001f1ee\U0001f1f3 (@shivaji_1983) September 2, 2021
Headquarters in Namma Bengaluru, Karnataka.
Keep Thinking will post over weekend\U0001f92a
6. Stock hits high 160-175 in 1995 & 1997
7. went into down trend, consolidated for 3 yrs 1999-2002
8. Gave breakout above 34 hinting at major shift in Feb 2002
9. Gave 1st multi year breakout in Oct 2003 above 160-175 which was failed
10. Next attempt in Sep 2004 crossed 175
11. Above 1995-1997 highs (160-175) stock went on to become 10x in a matter of 20-22 months
12. CMP 1344 Multi year breakout will trigger above 1950 on weekly closing basis
13. Will be watching 1st breakout above 1950
14. SL 1260/1100 depends on risk of the trader or investor
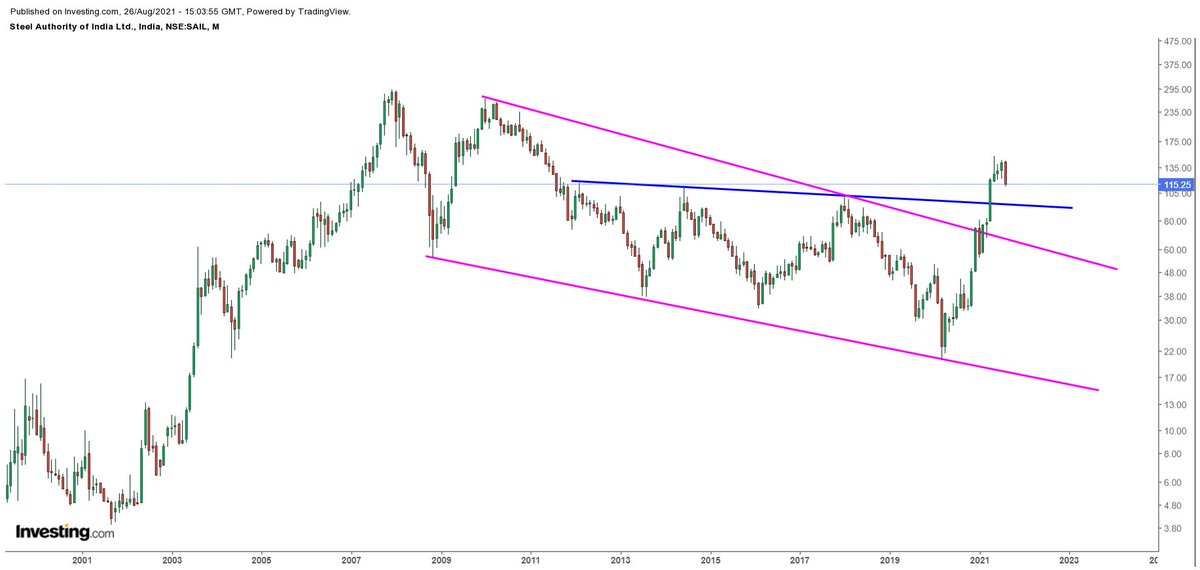
SAIL - If I say Sail can do 65-70 in worst case how many hearts will break? 🤪
105 is key, Bulls might defend for the time being. Once they fail during any downtrend Boy Bulls will be in serious trouble.
First targets 90-95 and worst case 65-70 (This i wil review later) https://t.co/RYaMwRQb7e
105 is key, Bulls might defend for the time being. Once they fail during any downtrend Boy Bulls will be in serious trouble.
First targets 90-95 and worst case 65-70 (This i wil review later) https://t.co/RYaMwRQb7e
Angle 2 -- On Log scale its end of this upmove from March 2020.
— Shivaji Vitthalrao\U0001f1ee\U0001f1f3 (@shivaji_1983) August 24, 2021
No major support until 90-92.
Conclusion - any rise to 123-128 is a sell opportunity
Bullish only above 145. Personally not bulish.
Potential taregts on downside are 105-90#SAIL pic.twitter.com/yZv2WXwIMU