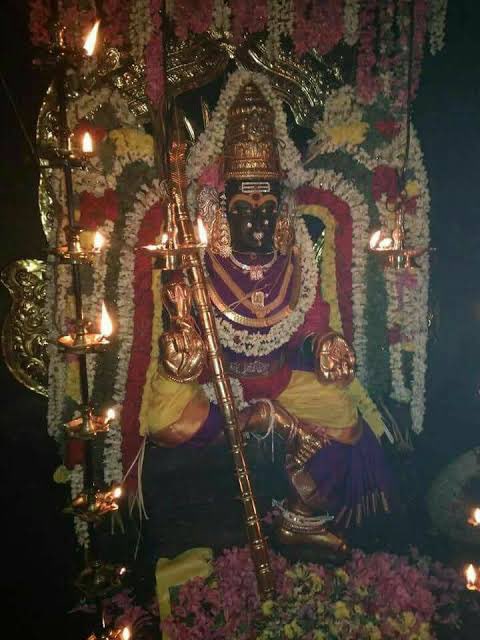
SRI LALITHAMBIGAI, THIRUMEYACHUR (TN)
#bharatmandir #navratri2021
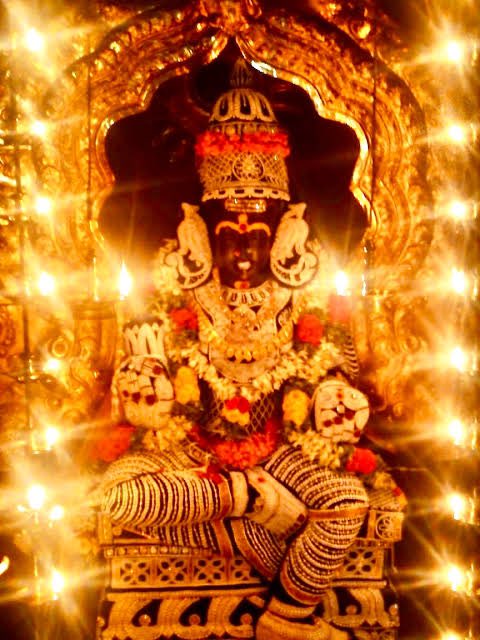
Kshetram where Shiva is worshipped as Meghanatha and his consort is Lalithambigai seen in Abhay mudra.
Once, a demon Pandasura was harassing the Devas who went to Devi Parashakti for protection.
@GunduHuDuGa
Devi rose from a Yaga Gunda, mounted on the Sri Chakra Rath with the name Lalithambika, waged a war against Pandasura and destroyed him. When her fury did not subside, Shiva asked her to go to Earth, assume the name Manonmani, perform penance and shed her fury.
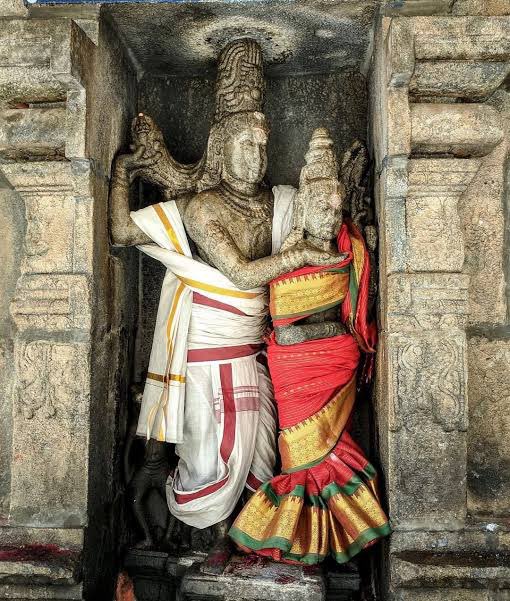
Shiva blessed Devi to be Shanta nayagi. There is a sculpture here depicting Shiva pacifying Devi. If you observe closely, you can see that from your left hand side there will be a smile on Her face and if you see from your right hand side you can see anger in Her face.
Hayagriva taught the greatness of Lalitha Sahasranama to Rishi Agasthya. Pleased with his devotion, Ma Lalithambikai appeared before Agastya. He is believed to have then sung Lalita Navaratnamala in praise of Devi. He has also composed a hymn named Rahasyanamasahasram.