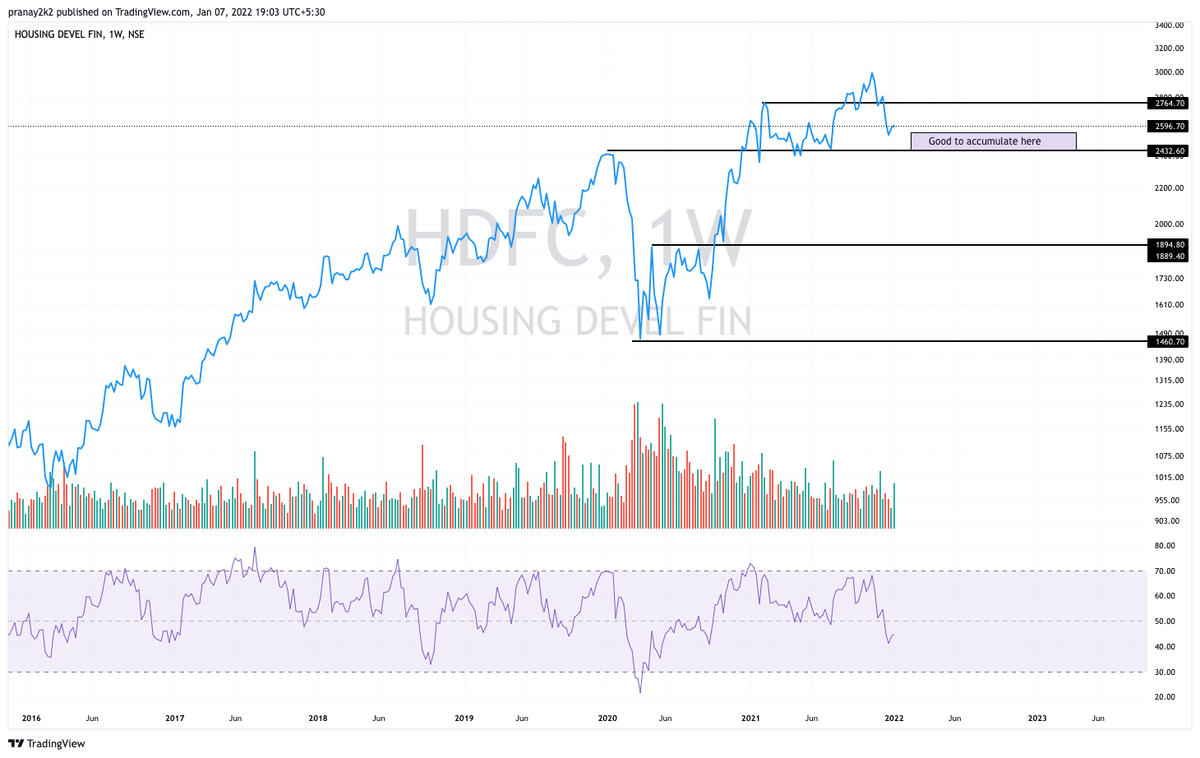
#HDFC has crossed & sustaining above major resistance of 2900. RSI & MACD looks bullish. If the stock sustains above 2900, it may surge towards 3440 in medium term.
#Nifty #NBFC
Not trading call, academic post

More from Techno Prince


More from Hdfc


IF #Nifty to go to 18850-19713 & more, heavy weights such as
#Hdfc (3190++)
#Hdfcbank (1724++)
#Reliance (2834++)
#ITC (274++) these are "just min. targets"
& many more would move up significantly
@rlnarayanan https://t.co/iVYE1F7l6v
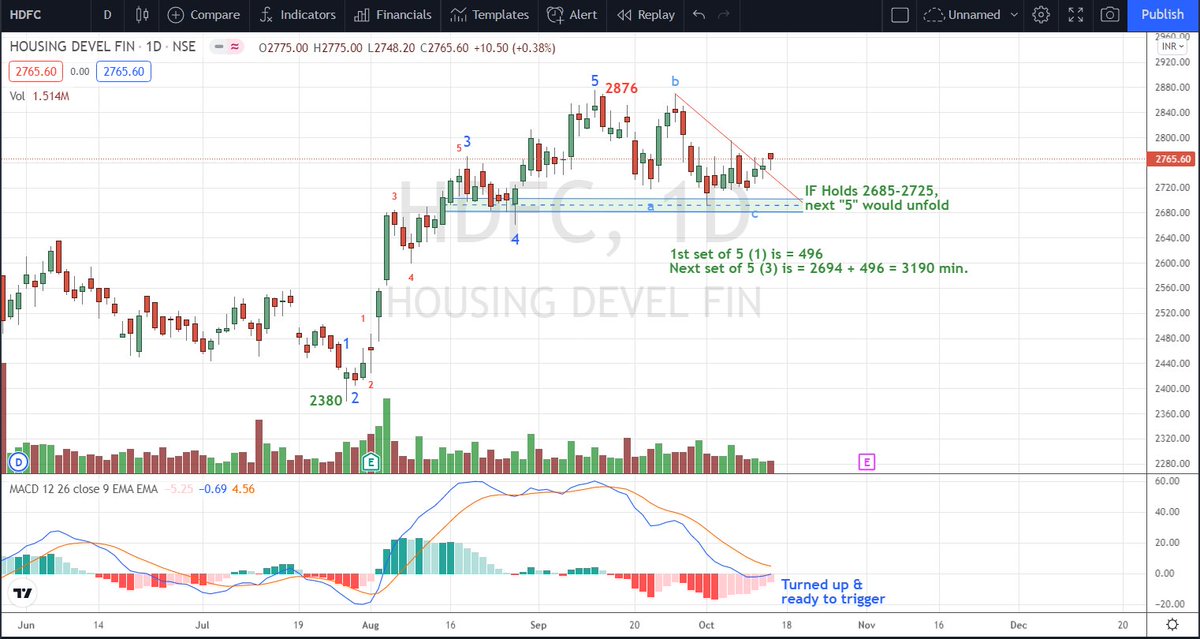
#Hdfc (3190++)
#Hdfcbank (1724++)
#Reliance (2834++)
#ITC (274++) these are "just min. targets"
& many more would move up significantly
@rlnarayanan https://t.co/iVYE1F7l6v
#Nifty 3rd is sub-dividing as in chart:
— Van Ilango (JustNifty) (@JustNifty) October 13, 2021
[1]st: 16396 - 17793 = 1397
[2]nd: 17793-17948-17453 - Irregular flat
[3]rd: 17453+1397=18850 OR
: 17453+1928=19381 OR
: 17453+2096=19549 OR
: 17453+2260=19713 OR
Nothing wrong in projecting till holds "17990"
You May Also Like


Trump is gonna let the Mueller investigation end all on it's own. It's obvious. All the hysteria of the past 2 weeks about his supposed impending firing of Mueller was a distraction. He was never going to fire Mueller and he's not going to
Mueller's officially end his investigation all on his own and he's gonna say he found no evidence of Trump campaign/Russian collusion during the 2016 election.
Democrats & DNC Media are going to LITERALLY have nothing coherent to say in response to that.
Mueller's team was 100% partisan.
That's why it's brilliant. NOBODY will be able to claim this team of partisan Democrats didn't go the EXTRA 20 MILES looking for ANY evidence they could find of Trump campaign/Russian collusion during the 2016 election
They looked high.
They looked low.
They looked underneath every rock, behind every tree, into every bush.
And they found...NOTHING.
Those saying Mueller will file obstruction charges against Trump: laughable.
What documents did Trump tell the Mueller team it couldn't have? What witnesses were withheld and never interviewed?
THERE WEREN'T ANY.
Mueller got full 100% cooperation as the record will show.
BREAKING: President Donald Trump has submitted his answers to questions from special counsel Robert Mueller
— Ryan Saavedra (@RealSaavedra) November 20, 2018
Mueller's officially end his investigation all on his own and he's gonna say he found no evidence of Trump campaign/Russian collusion during the 2016 election.
Democrats & DNC Media are going to LITERALLY have nothing coherent to say in response to that.
Mueller's team was 100% partisan.
That's why it's brilliant. NOBODY will be able to claim this team of partisan Democrats didn't go the EXTRA 20 MILES looking for ANY evidence they could find of Trump campaign/Russian collusion during the 2016 election
They looked high.
They looked low.
They looked underneath every rock, behind every tree, into every bush.
And they found...NOTHING.
Those saying Mueller will file obstruction charges against Trump: laughable.
What documents did Trump tell the Mueller team it couldn't have? What witnesses were withheld and never interviewed?
THERE WEREN'T ANY.
Mueller got full 100% cooperation as the record will show.