.@POTUS: "For the past year, we couldn't rely on the federal government to act with urgency and focus and coordination we needed. And we have seen the tragic costs of that failure."

More from Government

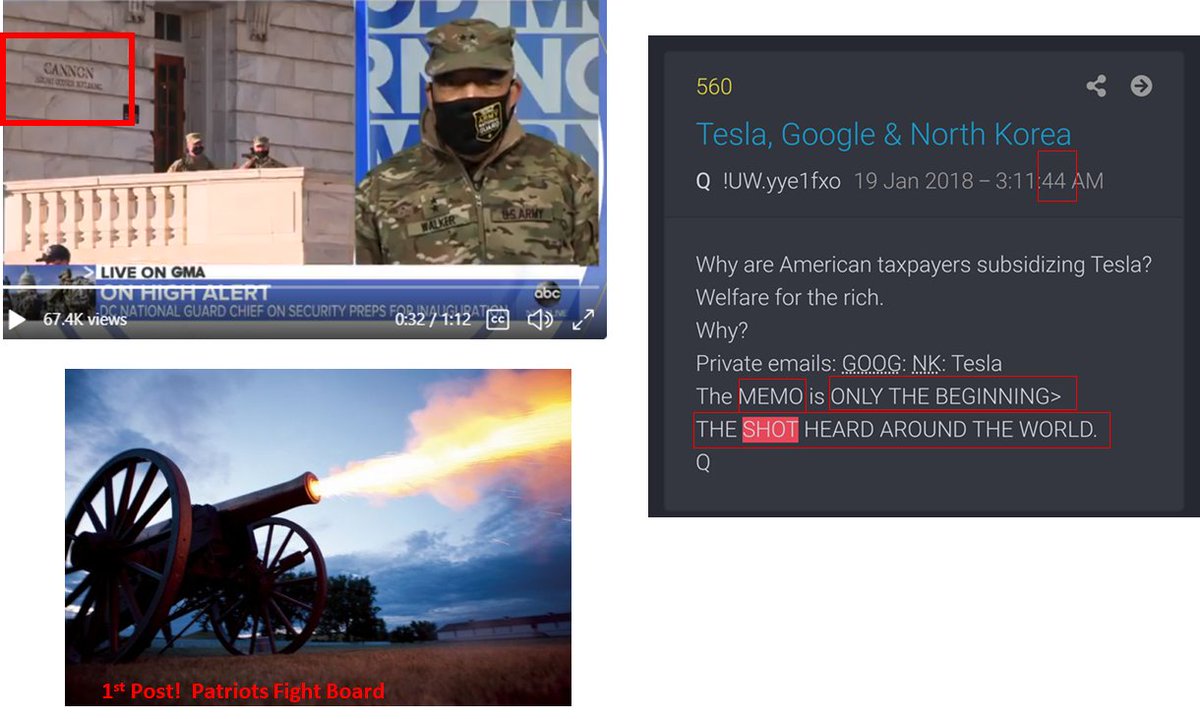
'Peaceful transition to Military Power....'
Cannon
44
....heard around the world
NG - High Alert https://t.co/lfeSiUCCRB
We Will Never Forget
44
Stage is set
https://t.co/h6G3LCevII
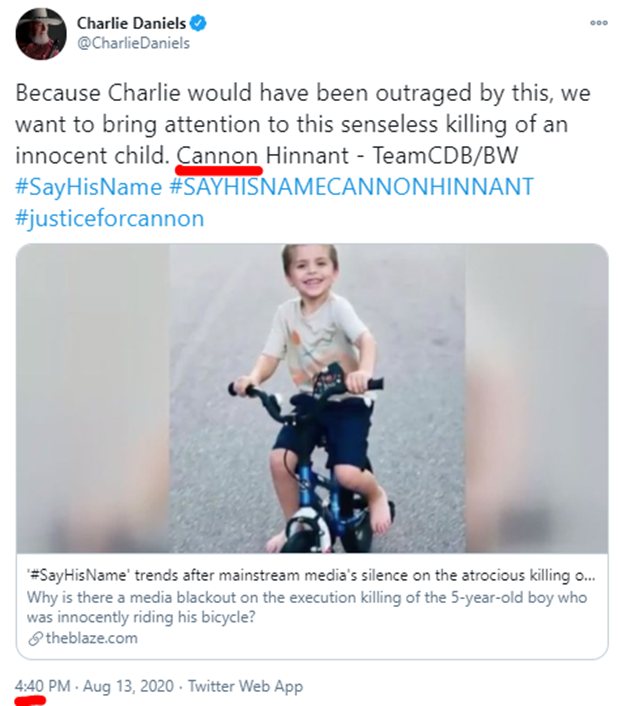
Following the 44 trail of breadrumbs
https://t.co/PcX0uKUEUW
Cannon
44
....heard around the world
NG - High Alert https://t.co/lfeSiUCCRB
\U0001f4a5 BOOM \U0001f4a5
— R\u0113d.P\u012bll.Ph\u0101rm\u0101c\u012bst (@Red_Pill_Pharma) January 18, 2021
30 secs in - what do I hear?
\u2018Peaceful transition to military power\u2019
\U0001f1fa\U0001f1f8 MILITARY IS THE ONLY WAY \U0001f1fa\U0001f1f8 pic.twitter.com/9NPMT7N7Qy
We Will Never Forget
44
Stage is set
https://t.co/h6G3LCevII
The stage is set. Staged.
— JeLove (@LovesTheLight) November 7, 2020
Where? (the) Delaware.
10:44
Purple
First graphic in 98https://t.co/PKHlxp0rzS pic.twitter.com/XCx6pVQTHx
Following the 44 trail of breadrumbs
https://t.co/PcX0uKUEUW
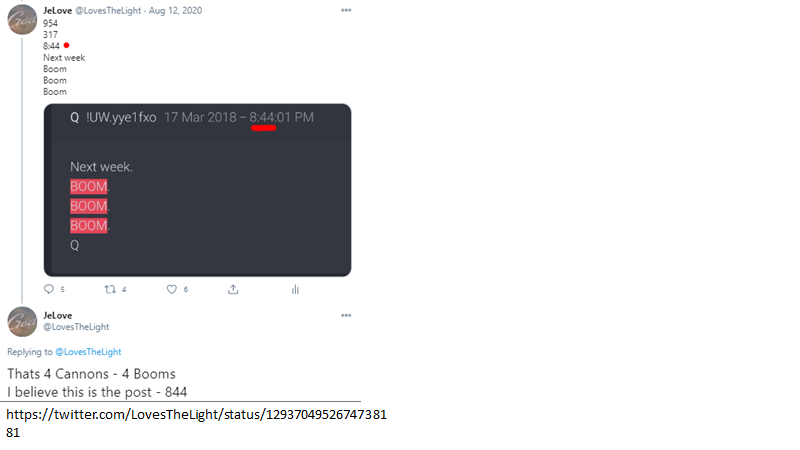
Boom, Boom, Boom pic.twitter.com/ZcZXAgL0Qf
— JeLove (@LovesTheLight) August 13, 2020


Which metric is a better predictor of the severity of the fall surge in US states?
1) Margin of Democrat victory in Nov 2020 election
or
2) % infected through Sep 1, 2020
Can you guess which plot is which?
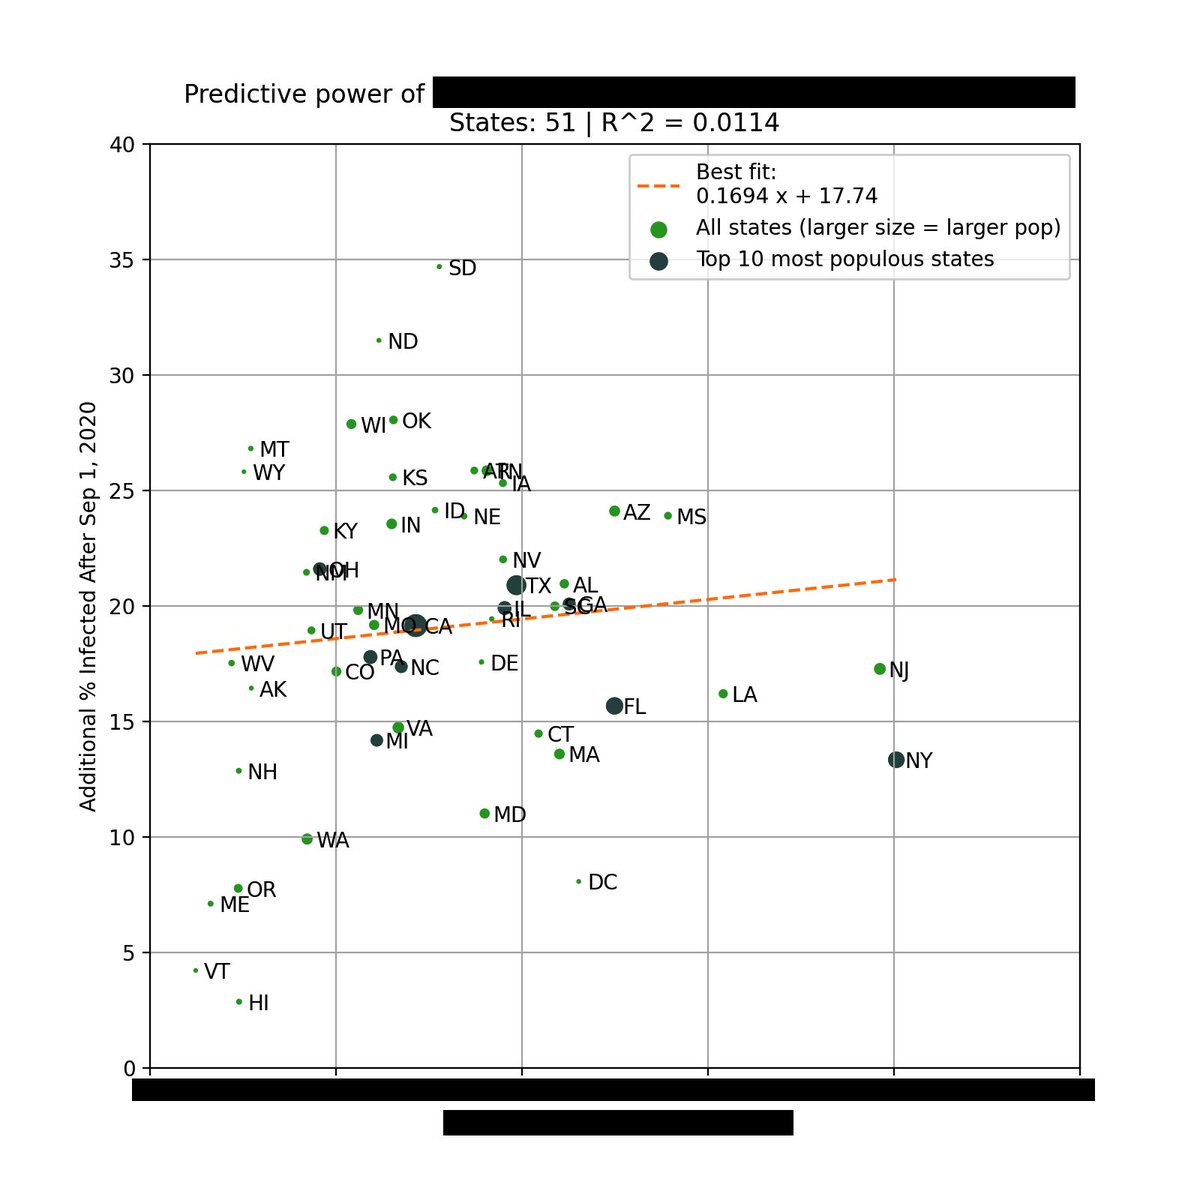
The left plot is based on the % infected through Sep 1, 2020. You can see that there is very little correlation with the % infected since Sep 1.
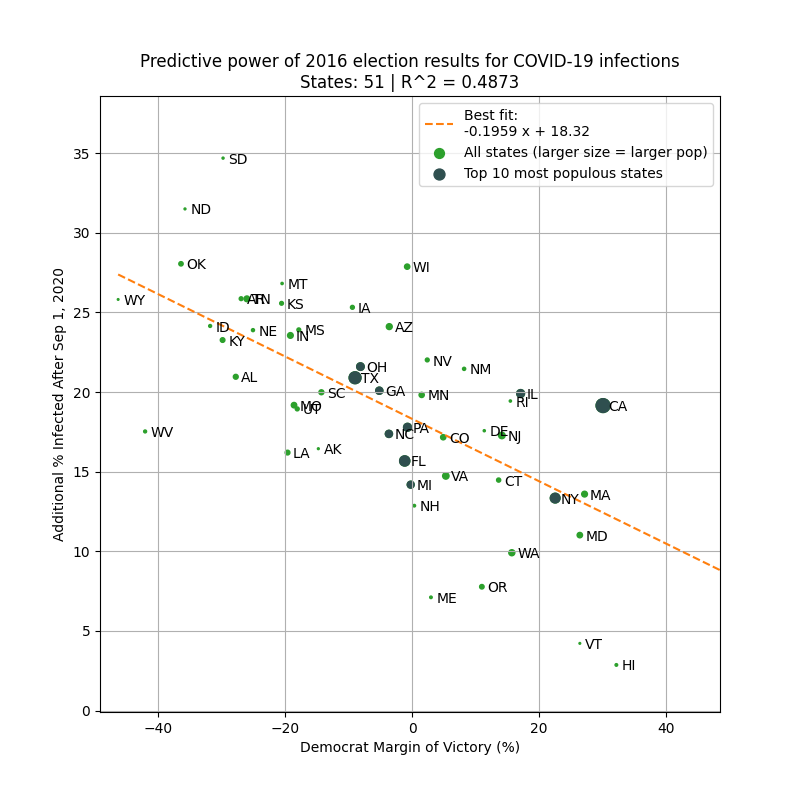
However, there is a *strong* correlation when using the margin of Biden's victory (right).
Infections % from https://t.co/WcXlfxv3Ah.

This is the strongest single variable I've seen in being able to explain the severity of this most recent wave in each state.
Not past infections / existing immunity, population density, racial makeup, latitude / weather / humidity, etc.
But political lean.
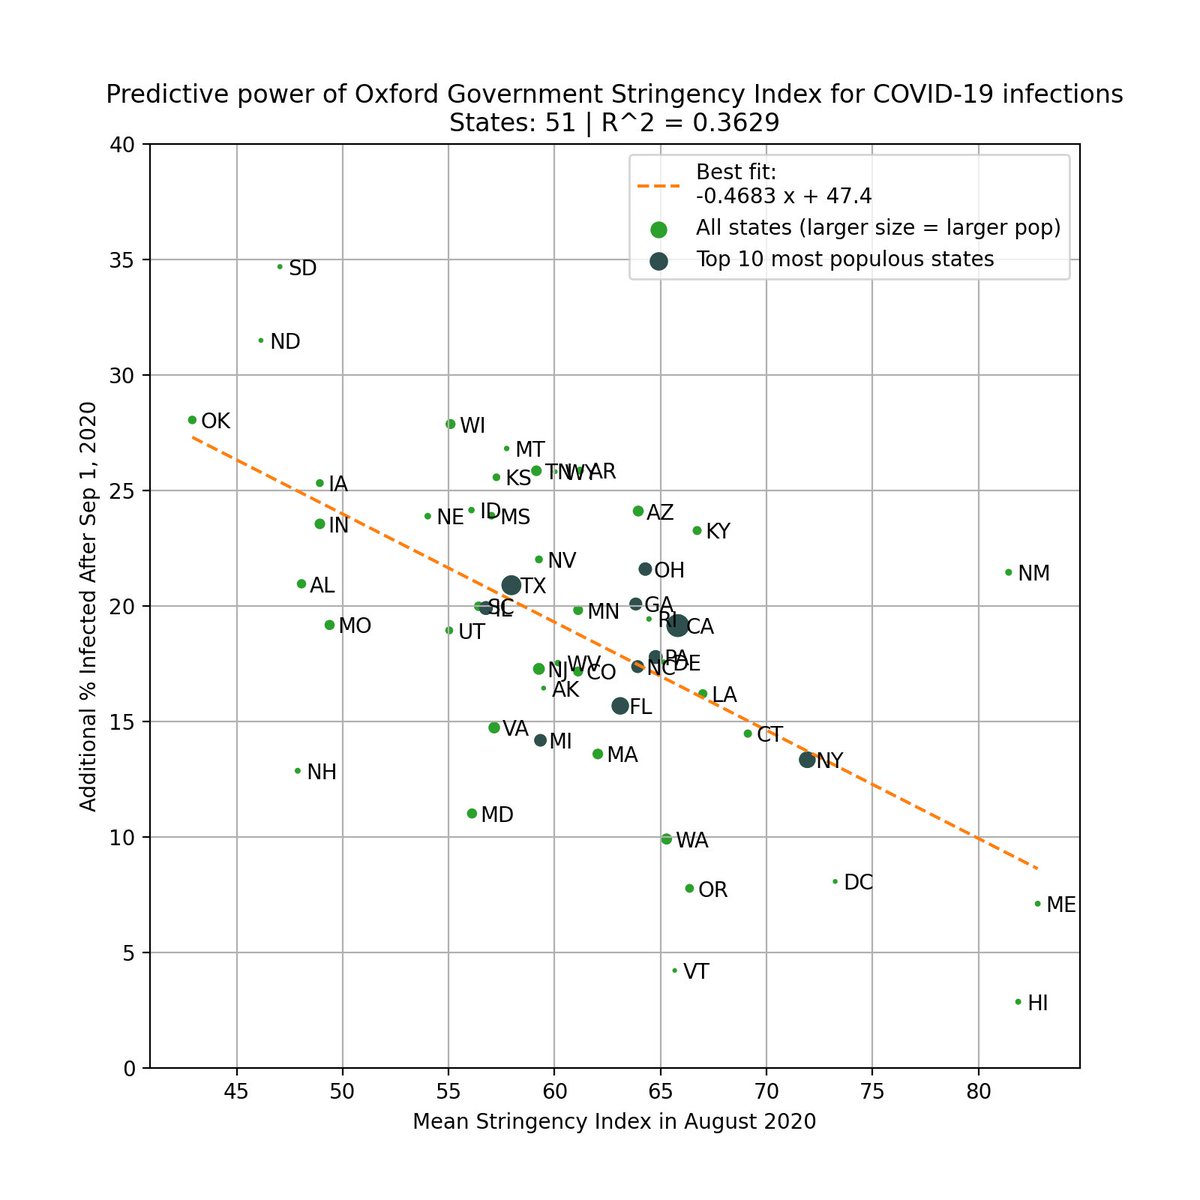
One can argue that states that lean Democrat are more likely to implement restrictions/mandates.
This is valid, so we test this by using the Government Stringency Index made by @UniofOxford.
We also see a correlation, but it's weaker (R^2=0.36 vs 0.50).
https://t.co/BxBBKwW6ta
To avoid look-ahead bias/confounding variables, here is the same analysis but using 2016 margin of victory as the predictor. Similar results.
This basically says that 2016 election results is a better predictor of the severity of the fall wave than intervention levels in 2020!
1) Margin of Democrat victory in Nov 2020 election
or
2) % infected through Sep 1, 2020
Can you guess which plot is which?
The left plot is based on the % infected through Sep 1, 2020. You can see that there is very little correlation with the % infected since Sep 1.
However, there is a *strong* correlation when using the margin of Biden's victory (right).
Infections % from https://t.co/WcXlfxv3Ah.
This is the strongest single variable I've seen in being able to explain the severity of this most recent wave in each state.
Not past infections / existing immunity, population density, racial makeup, latitude / weather / humidity, etc.
But political lean.
One can argue that states that lean Democrat are more likely to implement restrictions/mandates.
This is valid, so we test this by using the Government Stringency Index made by @UniofOxford.
We also see a correlation, but it's weaker (R^2=0.36 vs 0.50).
https://t.co/BxBBKwW6ta
To avoid look-ahead bias/confounding variables, here is the same analysis but using 2016 margin of victory as the predictor. Similar results.
This basically says that 2016 election results is a better predictor of the severity of the fall wave than intervention levels in 2020!
You May Also Like



12 TRADING SETUPS which experts are using.
These setups I found from the following 4 accounts:
1. @Pathik_Trader
2. @sourabhsiso19
3. @ITRADE191
4. @DillikiBiili
Share for the benefit of everyone.
Here are the setups from @Pathik_Trader Sir first.
1. Open Drive (Intraday Setup explained)
Bactesting results of Open Drive
2. Two Price Action setups to get good long side trade for intraday.
1. PDC Acts as Support
2. PDH Acts as
Example of PDC/PDH Setup given
These setups I found from the following 4 accounts:
1. @Pathik_Trader
2. @sourabhsiso19
3. @ITRADE191
4. @DillikiBiili
Share for the benefit of everyone.
Here are the setups from @Pathik_Trader Sir first.
1. Open Drive (Intraday Setup explained)
#OpenDrive#intradaySetup
— Pathik (@Pathik_Trader) April 16, 2019
Sharing one high probability trending setup for intraday.
Few conditions needs to be met
1. Opening should be above/below previous day high/low for buy/sell setup.
2. Open=low (for buy)
Open=high (for sell)
(1/n)
Bactesting results of Open Drive
Already explained strategy of #opendrive
— Pathik (@Pathik_Trader) May 27, 2020
Backtested results in 30 stocks and nifty, banknifty.
Success ratio : approx 40-45%
RR average 1:2
Entry as per strategy
Stoploss = Open level
Exit 3:15 PM Or SL
39 months 14 months -ve, 25 +ve
Yearly all 4 years +ve performance. pic.twitter.com/nGqhzMKGVy
2. Two Price Action setups to get good long side trade for intraday.
1. PDC Acts as Support
2. PDH Acts as
So today we will discuss two more price action setups to get good long side trade for intraday.
— Pathik (@Pathik_Trader) June 20, 2020
1. PDC Acts as Support
2. PDH Acts as Support
Example of PDC/PDH Setup given
#nifty
— Pathik (@Pathik_Trader) June 23, 2020
This is how it created long setup by taking support at PDC.
hopefully shared setup on last weekend helped. pic.twitter.com/2mduSUpMn5

A list of cool websites you might now know about
A thread 🧵
1) Learn Anything - Search tools for knowledge discovery that helps you understand any topic through the most efficient
2) Grad Speeches - Discover the best commencement speeches.
This website is made by me
3) What does the Internet Think - Find out what the internet thinks about anything
4) https://t.co/vuhT6jVItx - Send notes that will self-destruct after being read.
A thread 🧵
1) Learn Anything - Search tools for knowledge discovery that helps you understand any topic through the most efficient
2) Grad Speeches - Discover the best commencement speeches.
This website is made by me
3) What does the Internet Think - Find out what the internet thinks about anything
4) https://t.co/vuhT6jVItx - Send notes that will self-destruct after being read.