Let's discuss the environmental cost of the US dollar. Because despite all the push for sustainable and green investment in the government, there's a giant smoldering Chernobyl sitting at the heart of Washington which a lot of investors would prefer you remain quiet about. 🧵 (1/
More from Government


Abbott is pushing a lie to protect incompetence. There is no Federal oversight of the Texas Grid, ergo fewer regulations (sound familiar) - so point one: state legislature needs reform. 2/
2. Point 2: there were clear signs the grid would get overloaded under extreme cold conditions. Why? Due to a vacuum of regulations mandating winterization of turbines and power generators. This from sources, in Texas!
3. Point 3: Of the power shortfall that hit Texas, over 80% was due to problems at coal and gas fired plants. Power generators were just not winterized. Decisions to do so have been ignored since the 1990s.
4. Point 4: these are winterized wind turbines in Denmark. The ocean is frozen. The turbines are generating.
5. #Texas| the main issue is: catastrophic governance at the State level (no Federal oversight of the Texas grid) failing to allocate funding to winterise the Natural Gas, Coal and Wind Turbine elements that contribute to the grid. (~ 80/20
Texas Gov. Abbott blames solar and wind for the blackouts in his state and says "this shows how the Green New Deal would be a deadly deal for the United States of America" pic.twitter.com/YfVwa3YRZQ
— Andrew Lawrence (@ndrew_lawrence) February 17, 2021
2. Point 2: there were clear signs the grid would get overloaded under extreme cold conditions. Why? Due to a vacuum of regulations mandating winterization of turbines and power generators. This from sources, in Texas!
3. Point 3: Of the power shortfall that hit Texas, over 80% was due to problems at coal and gas fired plants. Power generators were just not winterized. Decisions to do so have been ignored since the 1990s.
4. Point 4: these are winterized wind turbines in Denmark. The ocean is frozen. The turbines are generating.
Same thing in Denmark. It's cold enough here that the ocean is frozen and yet look at those reliable windmills just chugging along. pic.twitter.com/1NTljk7hk9
— Elizabeth Gummere (@BethGummere) February 17, 2021
5. #Texas| the main issue is: catastrophic governance at the State level (no Federal oversight of the Texas grid) failing to allocate funding to winterise the Natural Gas, Coal and Wind Turbine elements that contribute to the grid. (~ 80/20

You May Also Like

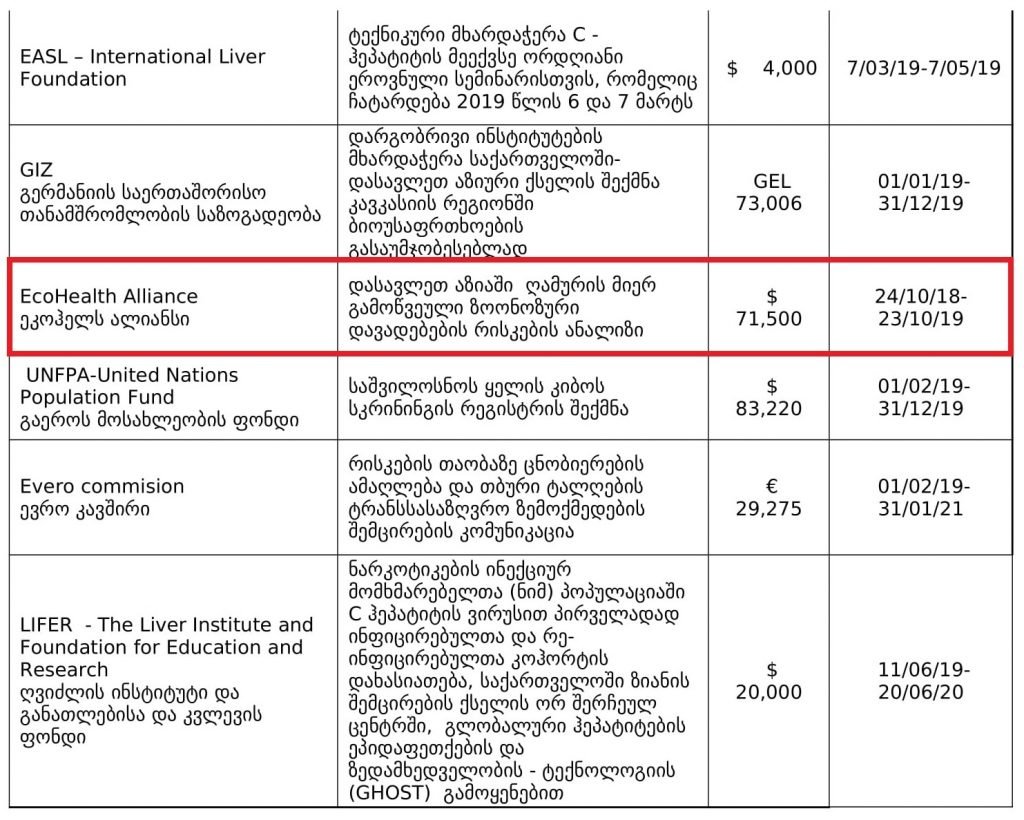
1. Project 1742 (EcoHealth/DTRA)
Risks of bat-borne zoonotic diseases in Western Asia
Duration: 24/10/2018-23 /10/2019
Funding: $71,500
@dgaytandzhieva
https://t.co/680CdD8uug
2. Bat Virus Database
Access to the database is limited only to those scientists participating in our ‘Bats and Coronaviruses’ project
Our intention is to eventually open up this database to the larger scientific community
https://t.co/mPn7b9HM48
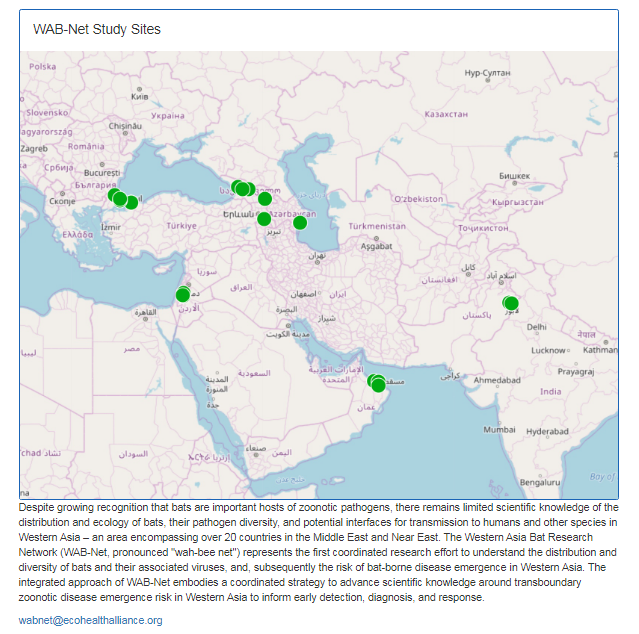
3. EcoHealth Alliance & DTRA Asking for Trouble
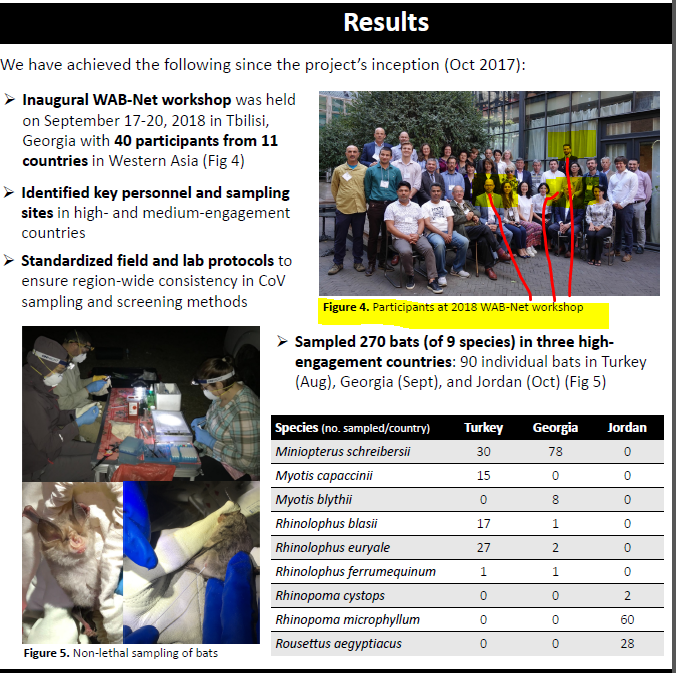
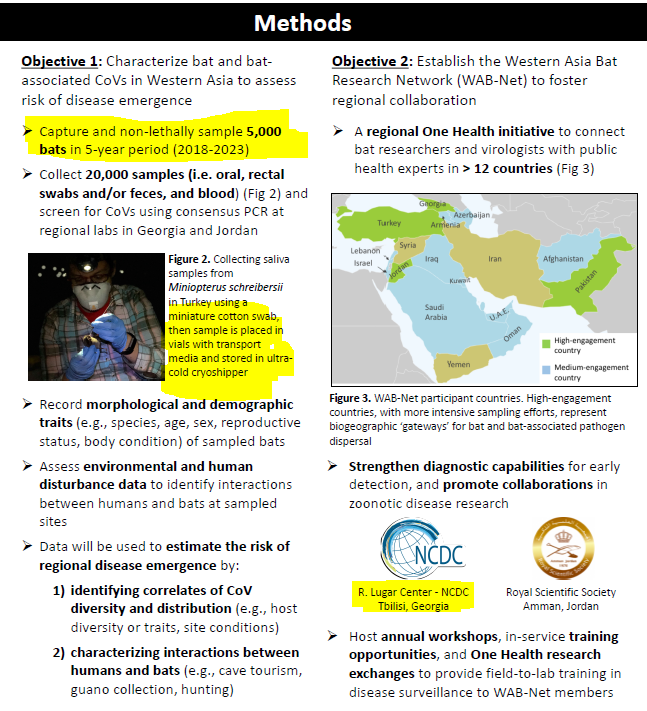
One Health research project focused on characterizing bat diversity, bat coronavirus diversity and the risk of bat-borne zoonotic disease emergence in the region.
https://t.co/u6aUeWBGEN
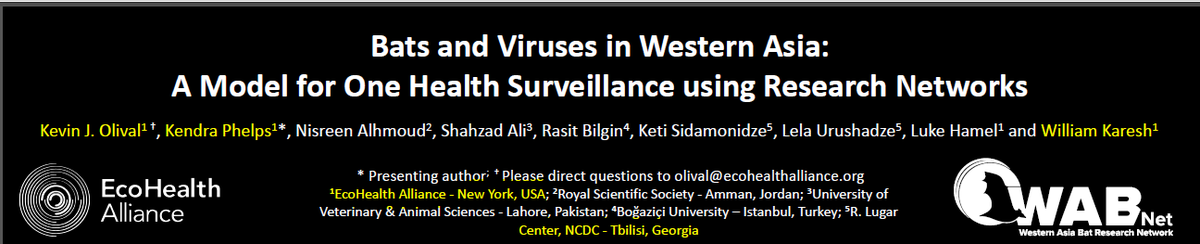
4. Phelps, Olival, Epstein, Karesh - EcoHealth/DTRA
5, Methods and Expected Outcomes
(Unexpected Outcome = New Coronavirus Pandemic)
Risks of bat-borne zoonotic diseases in Western Asia
Duration: 24/10/2018-23 /10/2019
Funding: $71,500
@dgaytandzhieva
https://t.co/680CdD8uug
2. Bat Virus Database
Access to the database is limited only to those scientists participating in our ‘Bats and Coronaviruses’ project
Our intention is to eventually open up this database to the larger scientific community
https://t.co/mPn7b9HM48
3. EcoHealth Alliance & DTRA Asking for Trouble
One Health research project focused on characterizing bat diversity, bat coronavirus diversity and the risk of bat-borne zoonotic disease emergence in the region.
https://t.co/u6aUeWBGEN
4. Phelps, Olival, Epstein, Karesh - EcoHealth/DTRA
5, Methods and Expected Outcomes
(Unexpected Outcome = New Coronavirus Pandemic)