More from Government

Act of 1871
This is VERY Long but it will end with a MEGA BOOM!
Bookmark it and read it in small bits to digest it all.
This info, comes from some reputable anons and my own digging, compiled together as a superthread!
InevitableET, IPOT... to name a few.
2.
https://t.co/udep5WEYUp
https://t.co/bnzeQek6zv

3.
The TL; DR version is they, by military force, and illegitimate legislature, amended the constitution against the will of The People and legally tricked us into becoming unwitting indentured slaves of human capital and resources to THE UNITED STATES OF AMERICA the corporation)
4.
Republic vs Democracy
-They needed to get away from the Republic and create a Democracy in order to drive us towards socialism and inevitably a dictatorship (National Socialist Party aka NAZI)

5.
Flag


You May Also Like


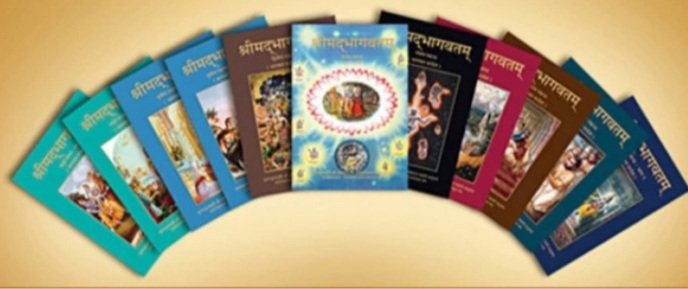
It was Ved Vyas who edited the eighteen thousand shlokas of Bhagwat. This book destroys all your sins. It has twelve parts which are like kalpvraksh.
In the first skandh, the importance of Vedvyas
and characters of Pandavas are described by the dialogues between Suutji and Shaunakji. Then there is the story of Parikshit.
Next there is a Brahm Narad dialogue describing the avtaar of Bhagwan. Then the characteristics of Puraan are mentioned.
It also discusses the evolution of universe.( https://t.co/2aK1AZSC79 )
Next is the portrayal of Vidur and his dialogue with Maitreyji. Then there is a mention of Creation of universe by Brahma and the preachings of Sankhya by Kapil Muni.
HOW LIFE EVOLVED IN THIS UNIVERSE AS PER OUR SCRIPTURES.
— Anshul Pandey (@Anshulspiritual) August 29, 2020
Well maximum of Living being are the Vansaj of Rishi Kashyap. I have tried to give stories from different-different Puran. So lets start.... pic.twitter.com/MrrTS4xORk
In the next section we find the portrayal of Sati, Dhruv, Pruthu, and the story of ancient King, Bahirshi.
In the next section we find the character of King Priyavrat and his sons, different types of loks in this universe, and description of Narak. ( https://t.co/gmDTkLktKS )
Thread on NARK(HELL) / \u0928\u0930\u094d\u0915
— Anshul Pandey (@Anshulspiritual) August 11, 2020
Well today i will take you to a journey where nobody wants to go i.e Nark. Hence beware of doing Adharma/Evil things. There are various mentions in Puranas about Nark, But my Thread is only as per Bhagwat puran(SS attached in below Thread)
1/8 pic.twitter.com/raHYWtB53Q
In the sixth part we find the portrayal of Ajaamil ( https://t.co/LdVSSNspa2 ), Daksh and the birth of Marudgans( https://t.co/tecNidVckj )
In the seventh section we find the story of Prahlad and the description of Varnashram dharma. This section is based on karma vaasna.
#THREAD
— Anshul Pandey (@Anshulspiritual) August 12, 2020
WHY PARENTS CHOOSE RELIGIOUS OR PARAMATMA'S NAMES FOR THEIR CHILDREN AND WHICH ARE THE EASIEST WAY TO WASH AWAY YOUR SINS.
Yesterday I had described the types of Naraka's and the Sin or Adharma for a person to be there.
1/8 pic.twitter.com/XjPB2hfnUC

Legacy site *downloads* ~630 KB CSS per theme and writing direction.
6,769 rules
9,252 selectors
16.7k declarations
3,370 unique declarations
44 media queries
36 unique colors
50 unique background colors
46 unique font sizes
39 unique z-indices
https://t.co/qyl4Bt1i5x

PWA *incrementally generates* ~30 KB CSS that handles all themes and writing directions.
735 rules
740 selectors
757 declarations
730 unique declarations
0 media queries
11 unique colors
32 unique background colors
15 unique font sizes
7 unique z-indices
https://t.co/w7oNG5KUkJ

The legacy site's CSS is what happens when hundreds of people directly write CSS over many years. Specificity wars, redundancy, a house of cards that can't be fixed. The result is extremely inefficient and error-prone styling that punishes users and developers.
The PWA's CSS is generated on-demand by a JS framework that manages styles and outputs "atomic CSS". The framework can enforce strict constraints and perform optimisations, which is why the CSS is so much smaller and safer. Style conflicts and unbounded CSS growth are avoided.