
GP State Department diplomats work for Pompeo, not the other way around. They should shut their yaps or quit.
Also, it's telling how much the horrible, illegal attacks on the Capitol have made establishment DC and its permanent bureaucracy quake in their boots.
U.S. State Department diplomats and staff have expressed outrage at Secretary of State Mike Pompeo\u2019s failure to acknowledge, much less protest, President Trump\u2019s role in inciting rioters who laid siege to the Capitol.https://t.co/NvjcKSpta9
— The New York Times (@nytimes) January 12, 2021
More from Government


🧵⬇️1. Fb is LifeLog, LifeLog is Darpa, and DARPA is a Enterprise Run by CIA... Well... Past President... Big Tech, Big Pharma, MSM, HOLLYWOOD, DC...
Past Presidents....Zuckerberg, Gates...
All C_A... the Family business.... The company...
2. Past Presidents....Zuckerberg, Gates...
All C_A... the Family business.... The company...The Farm.... all C_A assets... most of them related by blood, business, or marriage...

3. "The individual is handicapped by coming face-to-face with a conspiracy so monstrous he cannot believe it exists. The American mind simply has not come to a realization of the evil which has been introduced into our midst." - J. Edgar Hoover

4. diff. names & faces.... Monsters that lurk in the Shadows. Swamp, Deep State, Establishment, Globalist Elite Cabal...
Shall we go back...How far back...

5. I know these monsters... it's when I try to explain them to others is when I run into a problem.This is why I'm better at retweeting and compiling. I never know where to start... Everytime I try to thread, i end up w/ a messy monstrous web.I'm better at helping others thread.

Past Presidents....Zuckerberg, Gates...
All C_A... the Family business.... The company...
BREAKING\u2014 \u201cThis \u2018SHADOW GOVERNMENT\u2019 had a huge hand in running the show on Nov. 3 and you may have not known it\u201d says attorney Phil Kine. @newsmax pic.twitter.com/8ypASTEA1Z
— White Rabbit News \u277c (@WhiteRabbitNN) December 17, 2020
2. Past Presidents....Zuckerberg, Gates...
All C_A... the Family business.... The company...The Farm.... all C_A assets... most of them related by blood, business, or marriage...
3. "The individual is handicapped by coming face-to-face with a conspiracy so monstrous he cannot believe it exists. The American mind simply has not come to a realization of the evil which has been introduced into our midst." - J. Edgar Hoover
4. diff. names & faces.... Monsters that lurk in the Shadows. Swamp, Deep State, Establishment, Globalist Elite Cabal...
Shall we go back...How far back...
5. I know these monsters... it's when I try to explain them to others is when I run into a problem.This is why I'm better at retweeting and compiling. I never know where to start... Everytime I try to thread, i end up w/ a messy monstrous web.I'm better at helping others thread.


You May Also Like


1/12
RT-PCR corona (test) scam
Symptomatic people are tested for one and only one respiratory virus. This means that other acute respiratory infections are reclassified as
2/12
It is tested exquisitely with a hypersensitive non-specific RT-PCR test / Ct >35 (>30 is nonsense, >35 is madness), without considering Ct and clinical context. This means that more acute respiratory infections are reclassified as
3/12
The Drosten RT-PCR test is fabricated in a way that each country and laboratory perform it differently at too high Ct and that the high rate of false positives increases massively due to cross-reaction with other (corona) viruses in the "flu
4/12
Even asymptomatic, previously called healthy, people are tested (en masse) in this way, although there is no epidemiologically relevant asymptomatic transmission. This means that even healthy people are declared as COVID
5/12
Deaths within 28 days after a positive RT-PCR test from whatever cause are designated as deaths WITH COVID. This means that other causes of death are reclassified as
RT-PCR corona (test) scam
Symptomatic people are tested for one and only one respiratory virus. This means that other acute respiratory infections are reclassified as
4/10
— Dr. Thomas Binder, MD (@Thomas_Binder) October 22, 2020
...indication, first of all that testing for a (single) respiratory virus is done outside of surveillance systems or need for specific therapy, but even so the lack of consideration of Ct, symptoms and clinical findings when interpreting its result. https://t.co/gHH6kwRdZG
2/12
It is tested exquisitely with a hypersensitive non-specific RT-PCR test / Ct >35 (>30 is nonsense, >35 is madness), without considering Ct and clinical context. This means that more acute respiratory infections are reclassified as
6/10
— Dr. Thomas Binder, MD (@Thomas_Binder) October 22, 2020
The neither validated nor standardised hypersensitive RT-PCR test / Ct 35-45 for SARS-CoV-2 is abused to mislabel (also) other diseases, especially influenza, as COVID-19.https://t.co/AkFIfTCTkS
3/12
The Drosten RT-PCR test is fabricated in a way that each country and laboratory perform it differently at too high Ct and that the high rate of false positives increases massively due to cross-reaction with other (corona) viruses in the "flu
External peer review of the RTPCR test to detect SARS-CoV-2 reveals 10 major scientific flaws at the molecular and methodological level: consequences for false positive results.https://t.co/mbNY8bdw1p pic.twitter.com/OQBD4grMth
— Dr. Thomas Binder, MD (@Thomas_Binder) November 29, 2020
4/12
Even asymptomatic, previously called healthy, people are tested (en masse) in this way, although there is no epidemiologically relevant asymptomatic transmission. This means that even healthy people are declared as COVID
Thread web\u2b06\ufe0f\u2b07\ufe0f
— Dr. Thomas Binder, MD (@Thomas_Binder) December 16, 2020
The fabrication of the "asymptomatic (super) spreader" is the coronation of the total nons(ci)ense in the belief system of #CoronasWitnesses.
Asymptomatic transmission 0.7%; 95% CI 0%-4.9% - could well be 0%!https://t.co/VeZTzxXfvT
5/12
Deaths within 28 days after a positive RT-PCR test from whatever cause are designated as deaths WITH COVID. This means that other causes of death are reclassified as
8/8
— Dr. Thomas Binder, MD (@Thomas_Binder) March 24, 2020
By the way, who the f*** created this obviously (almost) worldwide definition of #CoronaDeath?
This is not only medical malpractice, this is utterly insane!https://t.co/FFsTx4L2mw


THREAD: 12 Things Everyone Should Know About IQ
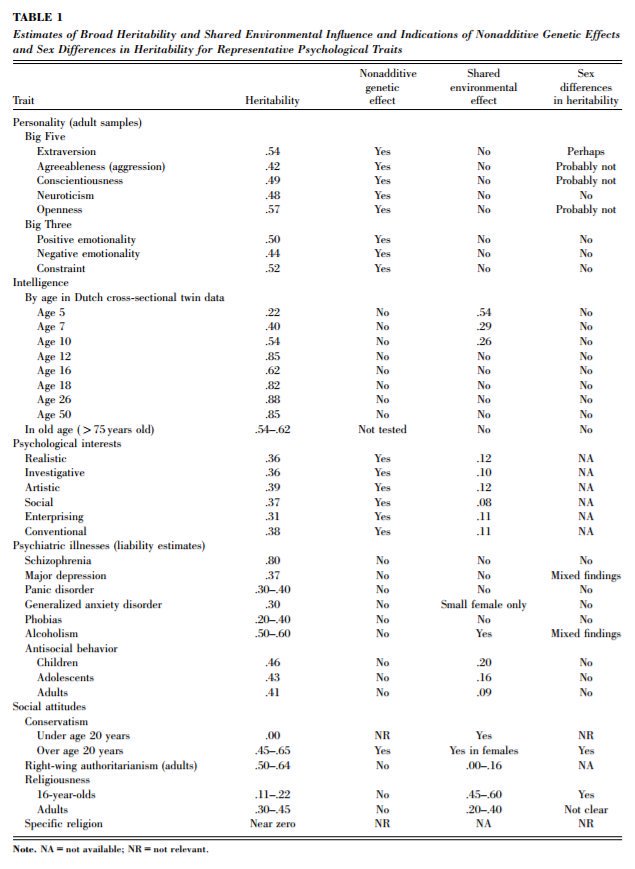
1. IQ is one of the most heritable psychological traits – that is, individual differences in IQ are strongly associated with individual differences in genes (at least in fairly typical modern environments). https://t.co/3XxzW9bxLE
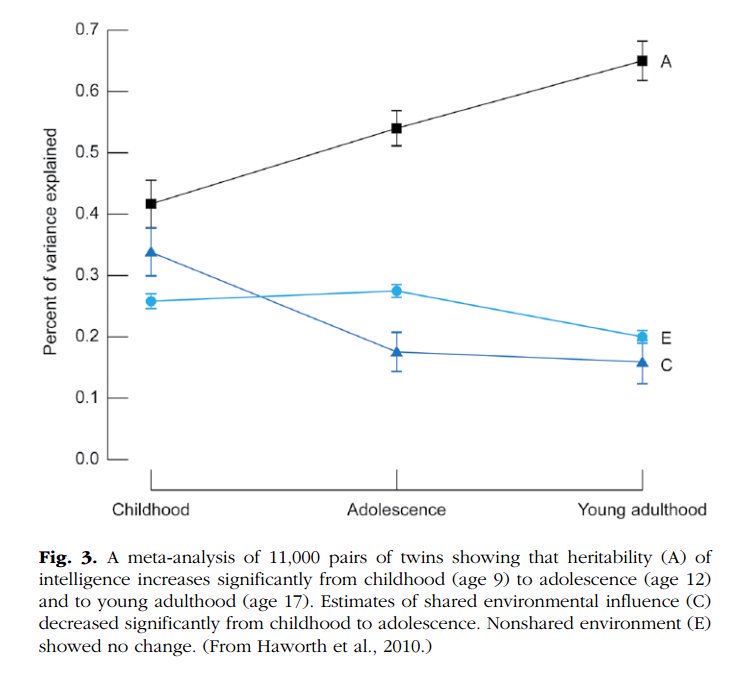
2. The heritability of IQ *increases* from childhood to adulthood. Meanwhile, the effect of the shared environment largely fades away. In other words, when it comes to IQ, nature becomes more important as we get older, nurture less. https://t.co/UqtS1lpw3n
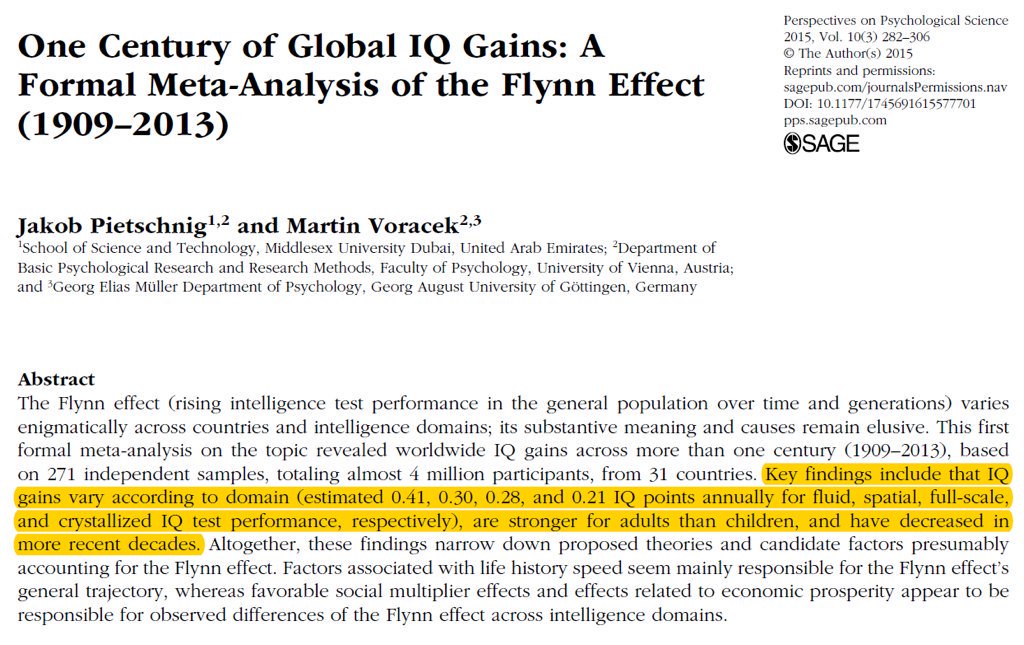
3. IQ scores have been increasing for the last century or so, a phenomenon known as the Flynn effect. https://t.co/sCZvCst3hw (N ≈ 4 million)
(Note that the Flynn effect shows that IQ isn't 100% genetic; it doesn't show that it's 100% environmental.)
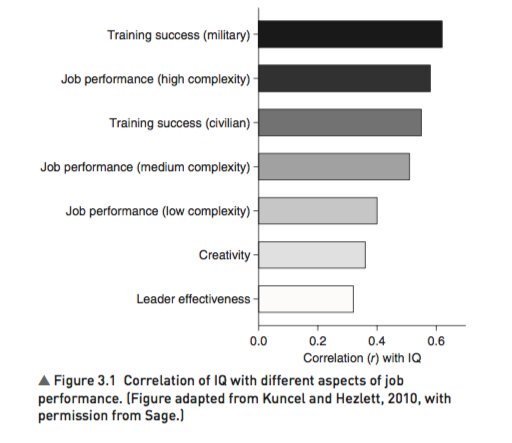
4. IQ predicts many important real world outcomes.
For example, though far from perfect, IQ is the single-best predictor of job performance we have – much better than Emotional Intelligence, the Big Five, Grit, etc. https://t.co/rKUgKDAAVx https://t.co/DWbVI8QSU3
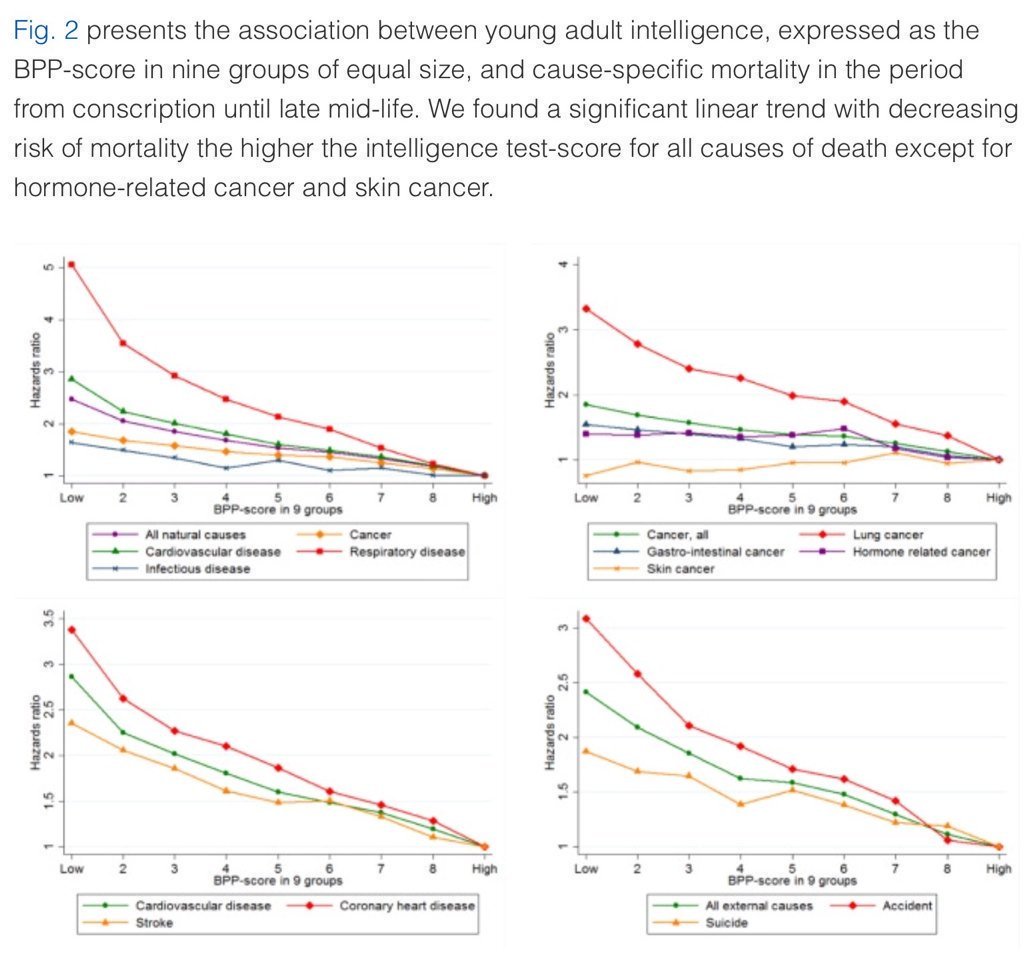
5. Higher IQ is associated with a lower risk of death from most causes, including cardiovascular disease, respiratory disease, most forms of cancer, homicide, suicide, and accident. https://t.co/PJjGNyeQRA (N = 728,160)
1. IQ is one of the most heritable psychological traits – that is, individual differences in IQ are strongly associated with individual differences in genes (at least in fairly typical modern environments). https://t.co/3XxzW9bxLE
2. The heritability of IQ *increases* from childhood to adulthood. Meanwhile, the effect of the shared environment largely fades away. In other words, when it comes to IQ, nature becomes more important as we get older, nurture less. https://t.co/UqtS1lpw3n
3. IQ scores have been increasing for the last century or so, a phenomenon known as the Flynn effect. https://t.co/sCZvCst3hw (N ≈ 4 million)
(Note that the Flynn effect shows that IQ isn't 100% genetic; it doesn't show that it's 100% environmental.)
4. IQ predicts many important real world outcomes.
For example, though far from perfect, IQ is the single-best predictor of job performance we have – much better than Emotional Intelligence, the Big Five, Grit, etc. https://t.co/rKUgKDAAVx https://t.co/DWbVI8QSU3
5. Higher IQ is associated with a lower risk of death from most causes, including cardiovascular disease, respiratory disease, most forms of cancer, homicide, suicide, and accident. https://t.co/PJjGNyeQRA (N = 728,160)
