Now what about scattered variables? Some of them look very old and thus kind of put our basic ideas of continuity and large-group classifications in question.
Let’s take a look at a couple of them and shiver at their

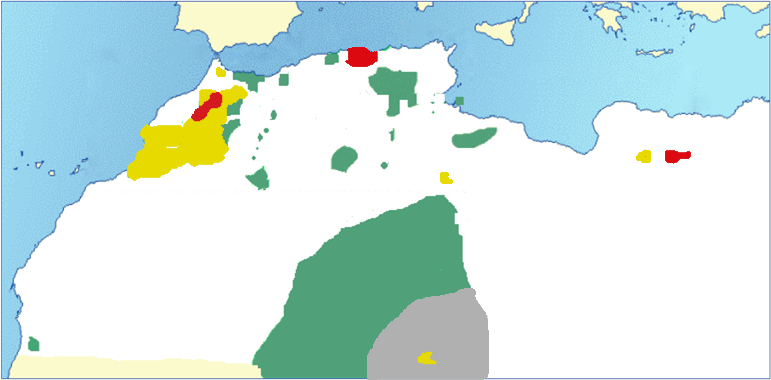
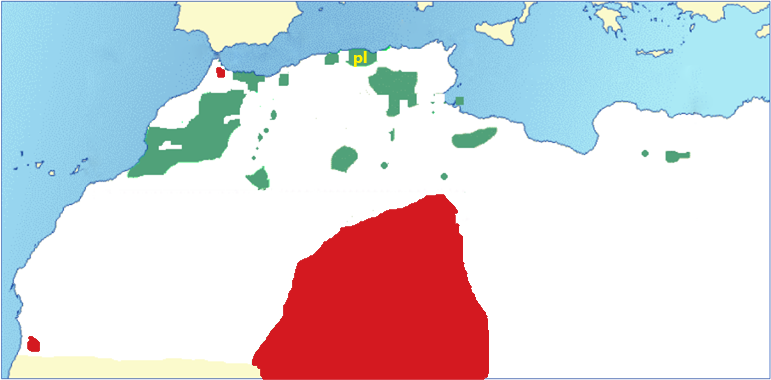
(1) The 2SG subject marker on the verb.

GREEN: -d
YELLOW -t (possibly a development from -d)
ReRED: -ḍ / -ṭ

There is no regular phonetic correspondence of -d to -ḍ.
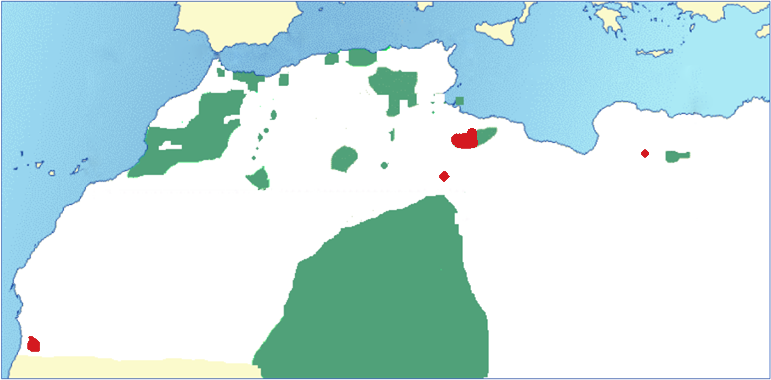
(2) In most varieties *β became (or remained?) /b/ in pre-consonantal position (GREEN). In a number of varieties, this didn’t happen (RED).
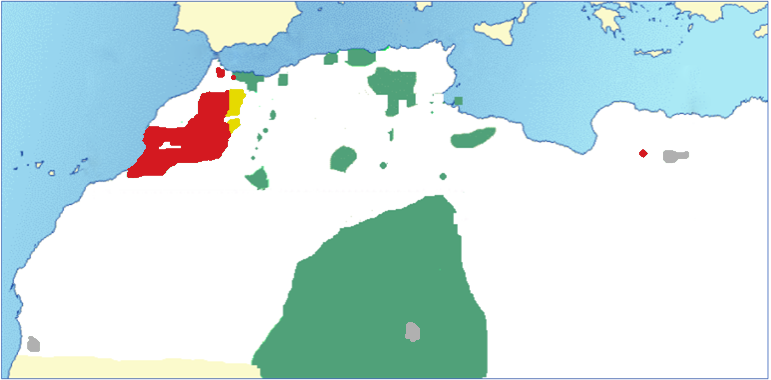
(3) The Imperative M:PL suffix is -at in western Morocco AND in Awjila (Libya) (RED). It is -ət / -ăt elsewhere (GREEN). The yellow part has different suffixes.
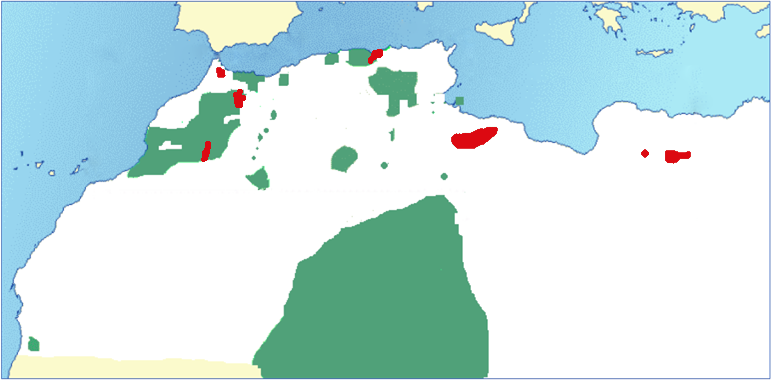
(4) The pharyngealized (“emphatic”) non-geminated alveolar is [dˁ] (or [ðˁ]) in most of Amazigh (GREEN), but in a scattered number of varieties, it is [tˁ] (RED).
So what are we going to do about these scattered attestations?

One of the strange things in Amazigh is that its varieties are quite similar to each other. Amazigh languages vary in the way Germanic languages do, or Romance. This suggests a rather late spread.
But there is no good reason why such a spread should have taken place. No big-time archeaological records of migrations, no long-lived Amazigh empires…
One way to get around it has been suggested by Carles Múrcia. In early Antiquity, Amazigh may have been more diverse than it is now. Due to koineization (extreme convergence) somewhere in Antiquity, most of this diversity would have been lost.

https://t.co/Gj4fb1AQDt
Groupings like the Central group would attest to splits following this koineization. The scattered isoglosses may very well be remnants of pre-koine variation (my interpretation, not necessarily that of Carles).
I will end this thread with an isogloss that may be related to the koine. The first one is the word for “cow”, which is /tafunast/ (GREEN) almost everywhere, except for some regions which still have the ancient Afroasiatic /tast/ (etc.) (RED; YELLOW only in he plural).
aseggwas nwem n jjdid d amimun!!!

NB. While all the outrageous things in this thread are mine, most of the good stuff was found out by others, ranging from colonial works like those by Edmond Destaing and modern work by brilliant scholars such as @lameensouag and @Phdnix.

More from Government

🔷 Rev. Raphael Warnock has become the first Democrat to win a Georgia Senate race in 20 years

The politician spoke to voters via MSNBC this morning

https://t.co/T9oJN2fjmo


Warnock is a pastor at the Ebenezer Baptist Church in Atlanta where civil rights leader Martin Luther King once preached.

He will become Georgia's first Black senator


This blue victory gives the Democrats the chance to regain control of the Senate for at least the first two years of the Biden presidency


"With Biden proposing to reverse President Donald Trump's tax cut, increase the minimum wage, and strengthen oversight on various industries, some might argue that his agenda is not particularly market-friendly," says Vasu Menon, investment strategy director at OCBC Bank
Which metric is a better predictor of the severity of the fall surge in US states?

1) Margin of Democrat victory in Nov 2020 election
or
2) % infected through Sep 1, 2020

Can you guess which plot is which?


The left plot is based on the % infected through Sep 1, 2020. You can see that there is very little correlation with the % infected since Sep 1.

However, there is a *strong* correlation when using the margin of Biden's victory (right).

Infections % from
https://t.co/WcXlfxv3Ah.


This is the strongest single variable I've seen in being able to explain the severity of this most recent wave in each state.

Not past infections / existing immunity, population density, racial makeup, latitude / weather / humidity, etc.

But political lean.

One can argue that states that lean Democrat are more likely to implement restrictions/mandates.

This is valid, so we test this by using the Government Stringency Index made by @UniofOxford.

We also see a correlation, but it's weaker (R^2=0.36 vs 0.50).

https://t.co/BxBBKwW6ta


To avoid look-ahead bias/confounding variables, here is the same analysis but using 2016 margin of victory as the predictor. Similar results.

This basically says that 2016 election results is a better predictor of the severity of the fall wave than intervention levels in 2020!

You May Also Like