

NEVER FORGET how stupid [THEY] have been from the beginning!!!
BOTH @GenFlynn and #AdmMikeRogers went to Trump Tower on Nov 17, 2016.
IMPORTANT DATE to remember!!!! (THREAD)
https://t.co/h2WcgKEM58

This was a SETUP by #POTUS and Team because they KNEW about surveillance (From Adm Rogers/Flynn)....
(Trump later in 2017 tweeted that he "just found out" about Obama surveillance...KEK!)

That Nov. 22 tweet was BAIT to CATCH THEM spying in the very beginning (and they spied even before that)!!
"We have it all." - 17


More from Government

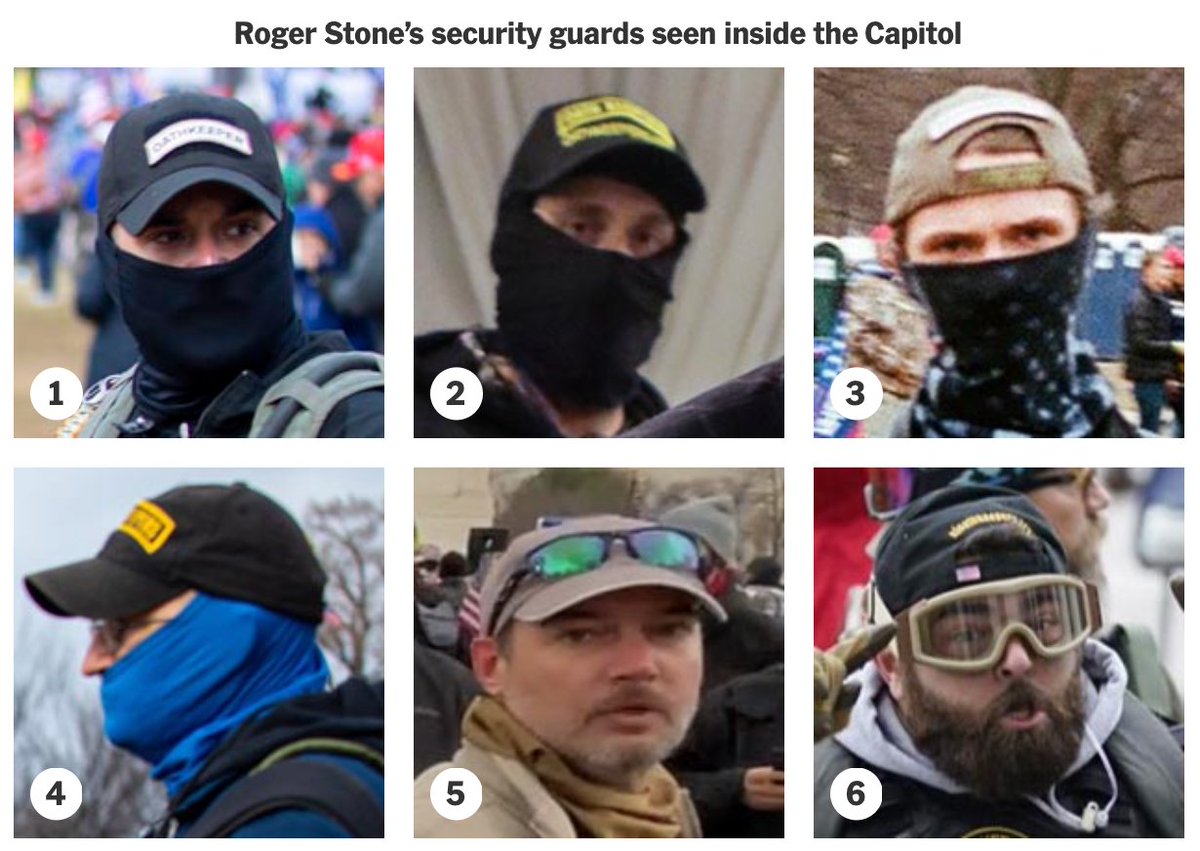
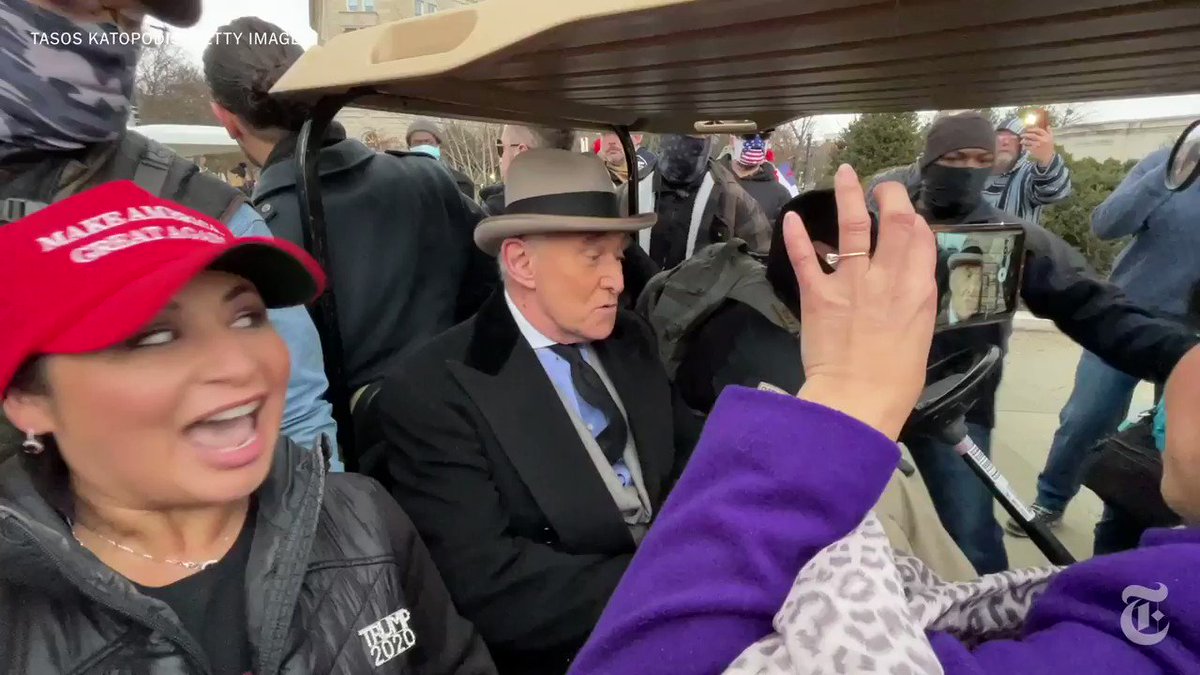
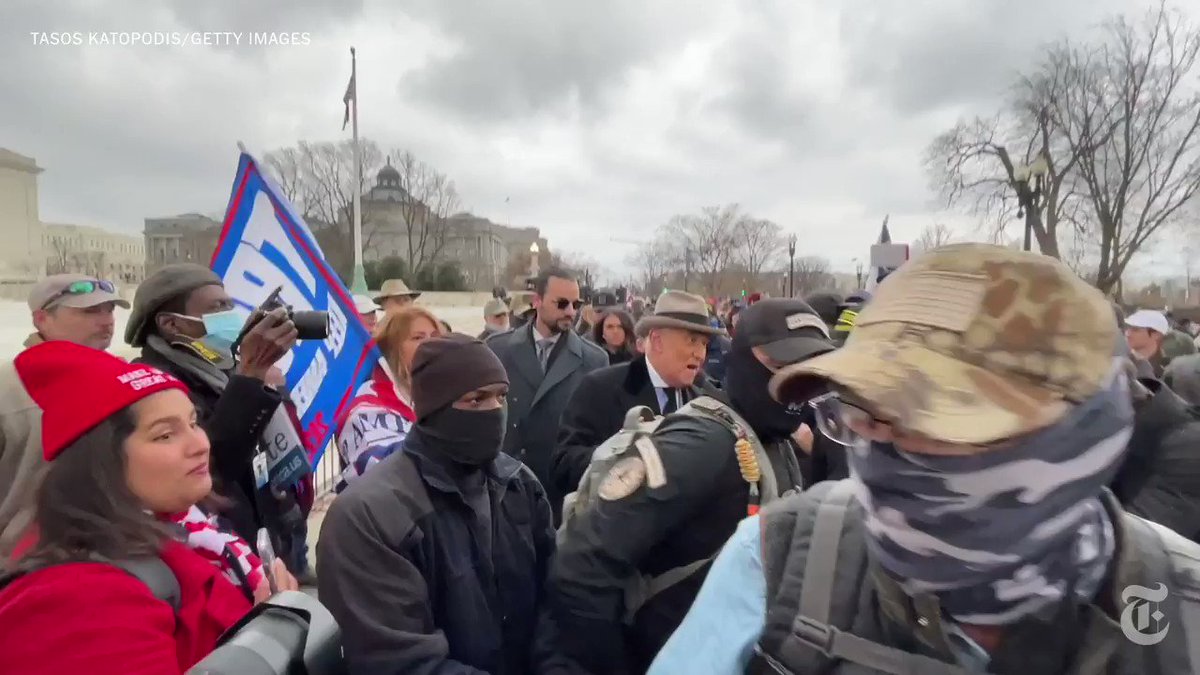
The Manatee-Sarasota area has many connections to the horrific scene of insurrection in Washington DC yesterday. Want to see? Buckle up for this thread: /1
The Manatee GOP expressed support for Josh Hawley’s objections to certification of the electoral college vote. /2
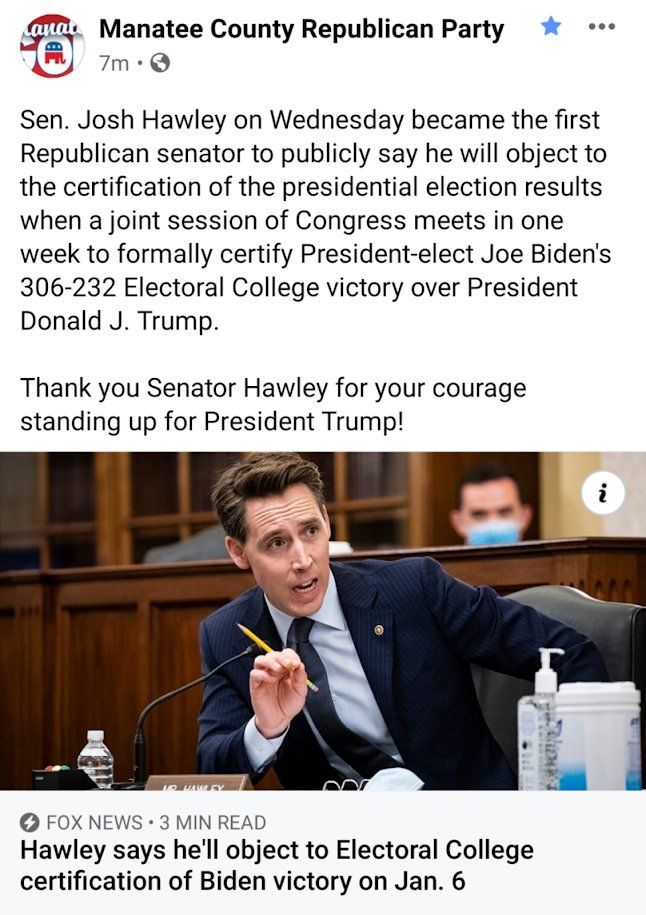
Josh Hawley’s home-state newspaper says Hawley has blood on his hands for a “Capitol coup attempt.” This is who the Manatee GOP cheered on.
Florida GOP Vice Chair & Sarasota County Commissioner Christian Ziegler was at the protest, as described in this @HeraldTribune article.
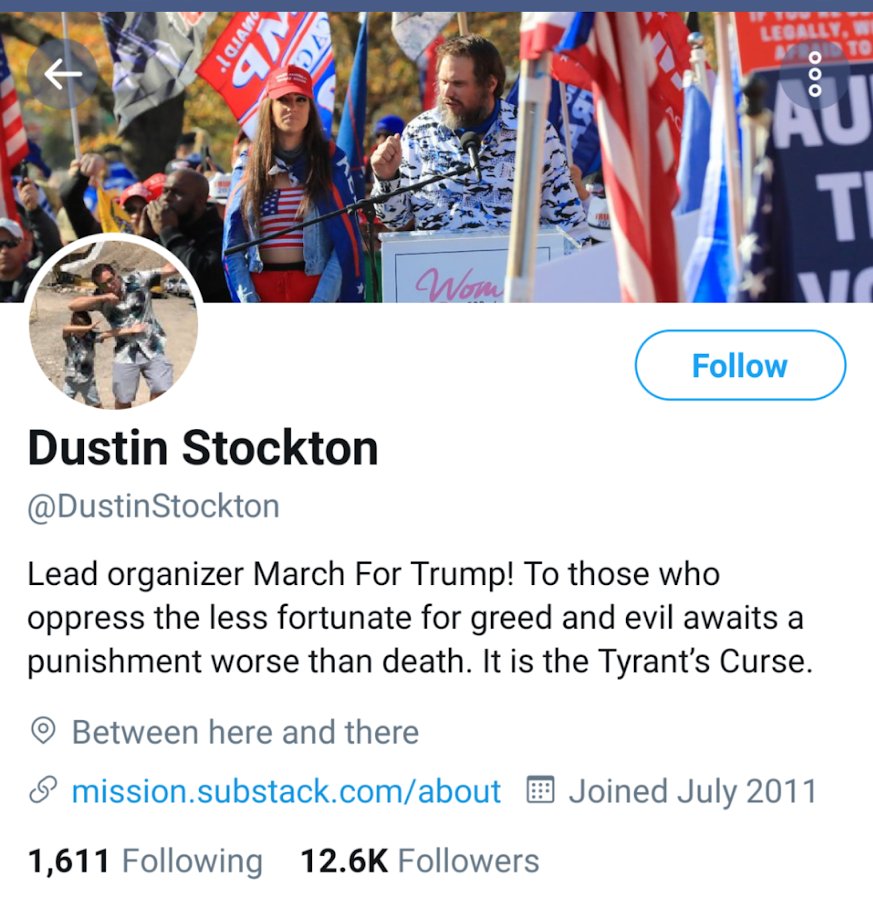
The protest was led by the same people connected to Ziegler who were filming outside the Vern Buchanan town hall at the Van Wezel in Sarasota in 2017, namely Dustin Stockton. Stockton was also part of Steve Bannon's border wall group. /5
https://t.co/NbOxVqbtO4
The Manatee GOP expressed support for Josh Hawley’s objections to certification of the electoral college vote. /2
Josh Hawley’s home-state newspaper says Hawley has blood on his hands for a “Capitol coup attempt.” This is who the Manatee GOP cheered on.
Florida GOP Vice Chair & Sarasota County Commissioner Christian Ziegler was at the protest, as described in this @HeraldTribune article.
The protest was led by the same people connected to Ziegler who were filming outside the Vern Buchanan town hall at the Van Wezel in Sarasota in 2017, namely Dustin Stockton. Stockton was also part of Steve Bannon's border wall group. /5
https://t.co/NbOxVqbtO4


The Government is making the same mistakes as it did in the first wave. Except with knowledge.
A thread.
The Government's strategy at the beginning of the pandemic was to 'cocoon' the vulnerable (e.g. those in care homes). This was a 'herd immunity' strategy. This interview is from
This strategy failed. It is impossible to 'cocoon' the vulnerable, as Covid is passed from younger people to older, more vulnerable people.
We can see this playing out through heatmaps. e.g. these heatmaps from the second
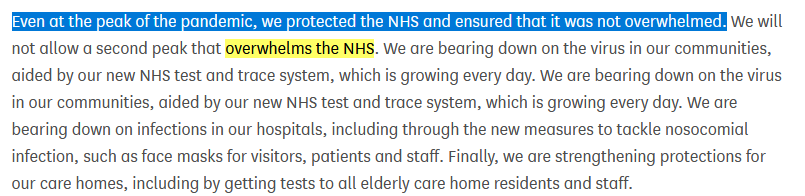
The Government then decided to change its strategy to 'preventing a second wave that overwhelms the NHS'. This was announced on 8 June in Parliament.
This is not the same as 'preventing a second wave'.
https://t.co/DPWiJbCKRm
The Academy of Medical Scientists published a report on 14 July 'Preparing for a Challenging Winter' commissioned by the Chief Scientific Adviser that set out what needed to be done in order to prevent a catastrophe over the winter
A thread.
The Government's strategy at the beginning of the pandemic was to 'cocoon' the vulnerable (e.g. those in care homes). This was a 'herd immunity' strategy. This interview is from
Government #coronavirus science advisor Dr David Halpern tells me of plans to \u2018cocoon\u2019 vulnerable groups. pic.twitter.com/dhECJNbmnI
— Mark Easton (@BBCMarkEaston) March 11, 2020
This strategy failed. It is impossible to 'cocoon' the vulnerable, as Covid is passed from younger people to older, more vulnerable people.
We can see this playing out through heatmaps. e.g. these heatmaps from the second
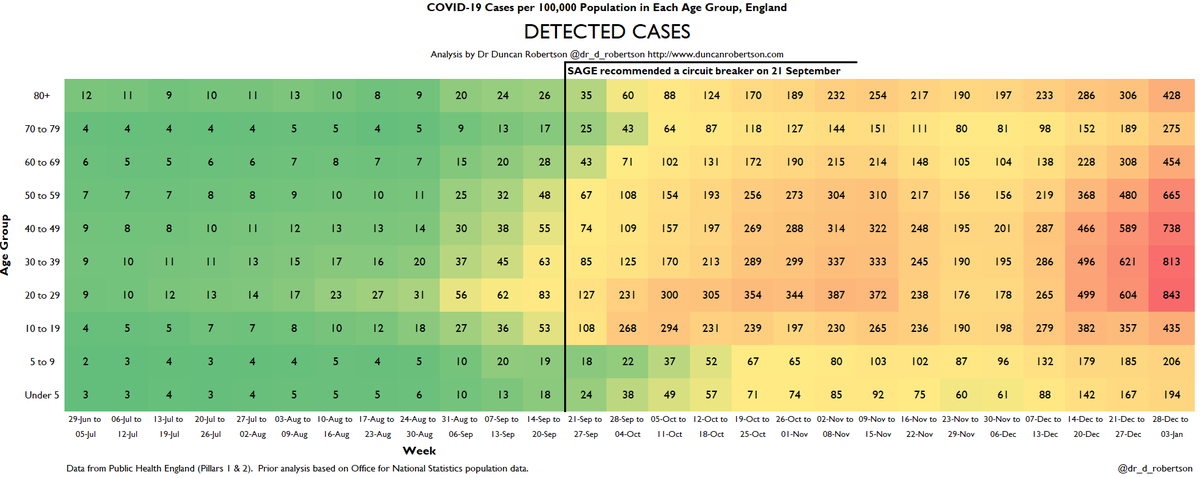
Here are the heatmaps for Covid detected cases, positivity, hospitalizations, and ICU admissions. This is for the week to 3 January 2021.
— Dr Duncan Robertson (@Dr_D_Robertson) January 7, 2021
I have marked a line on 21 September, when SAGE recommended a circuit breaker, so you can see how the situation has deteriorated since then. pic.twitter.com/SEEVgUVK4j
The Government then decided to change its strategy to 'preventing a second wave that overwhelms the NHS'. This was announced on 8 June in Parliament.
This is not the same as 'preventing a second wave'.
https://t.co/DPWiJbCKRm
The Academy of Medical Scientists published a report on 14 July 'Preparing for a Challenging Winter' commissioned by the Chief Scientific Adviser that set out what needed to be done in order to prevent a catastrophe over the winter
One thing civil servants learn is to write things down. Here is @acadmedsci's 14 July report commissioned by @uksciencechief. For the record.
— Dr Duncan Robertson (@Dr_D_Robertson) September 17, 2020


You May Also Like


Facebook originally a CIA program called "LifeLog".
LifeLog, via DARPA, terminated on Feb 4th, 2004.
Facebook was launched on Feb 4th, 2004.
Many of the LifeLog team became execs at FB.
Zuckerberg is a figurehead.
CIA allowed Cambridge to help Trump win
https://t.co/enzOXDCogV

Pentagon Kills LifeLog
LifeLog, via DARPA, terminated on Feb 4th, 2004.
Facebook was launched on Feb 4th, 2004.
Many of the LifeLog team became execs at FB.
Zuckerberg is a figurehead.
CIA allowed Cambridge to help Trump win
https://t.co/enzOXDCogV
Project: Lifelog
— Robert Horan (@Robby12692) December 13, 2018
Started by DARPA in 1999, the goal of Lifelog was to create a database on civilians without their knowledge, and track everything they do.
The project "ended" on Feb 4th, 2004.
Facebook began the exact same day.
The CIA funneled tens of millions into Facebook. pic.twitter.com/r7hwF0v9kh
Pentagon Kills LifeLog


