I write to raise very
Dear @SecDef :
First, as an African American Navy veteran who is the daughter of one of the first five Black Men to serve as officers on the USS Midway in the 50s, I cannot express how delighted & proud I am of you and yours ascension to the awesome responsibility & authority
I write to raise very
As I am sure you know, FoxNews, OANN and Newsmax have been selling white supremacy grievance as a business model for years
As the events of January 6, and the ongoing investigations that have ensued demonstrate, the poison of those
It is killing off their discernment, causing them to encamp on absolute lies & fiction, tearing them apart from their fellow brothers & sisters in arms, and in too many cases, inciting people who swear to defend the
The removal of these outlets from all federal buildings is entirely the prerogative of the President, but President Biden would never make such a move without a recommendation from you.
And so I write this missive to you to ask
This is a matter of national security, as well as good order & discipline. No way will the American people tolerate the taxes they pay to train & equip the best
The complicity of dozens of active duty, reserve & ex-military in the insurrection this month cannot be
More from Pam Keith, Esq.
More from Government






Which metric is a better predictor of the severity of the fall surge in US states?
1) Margin of Democrat victory in Nov 2020 election
or
2) % infected through Sep 1, 2020
Can you guess which plot is which?
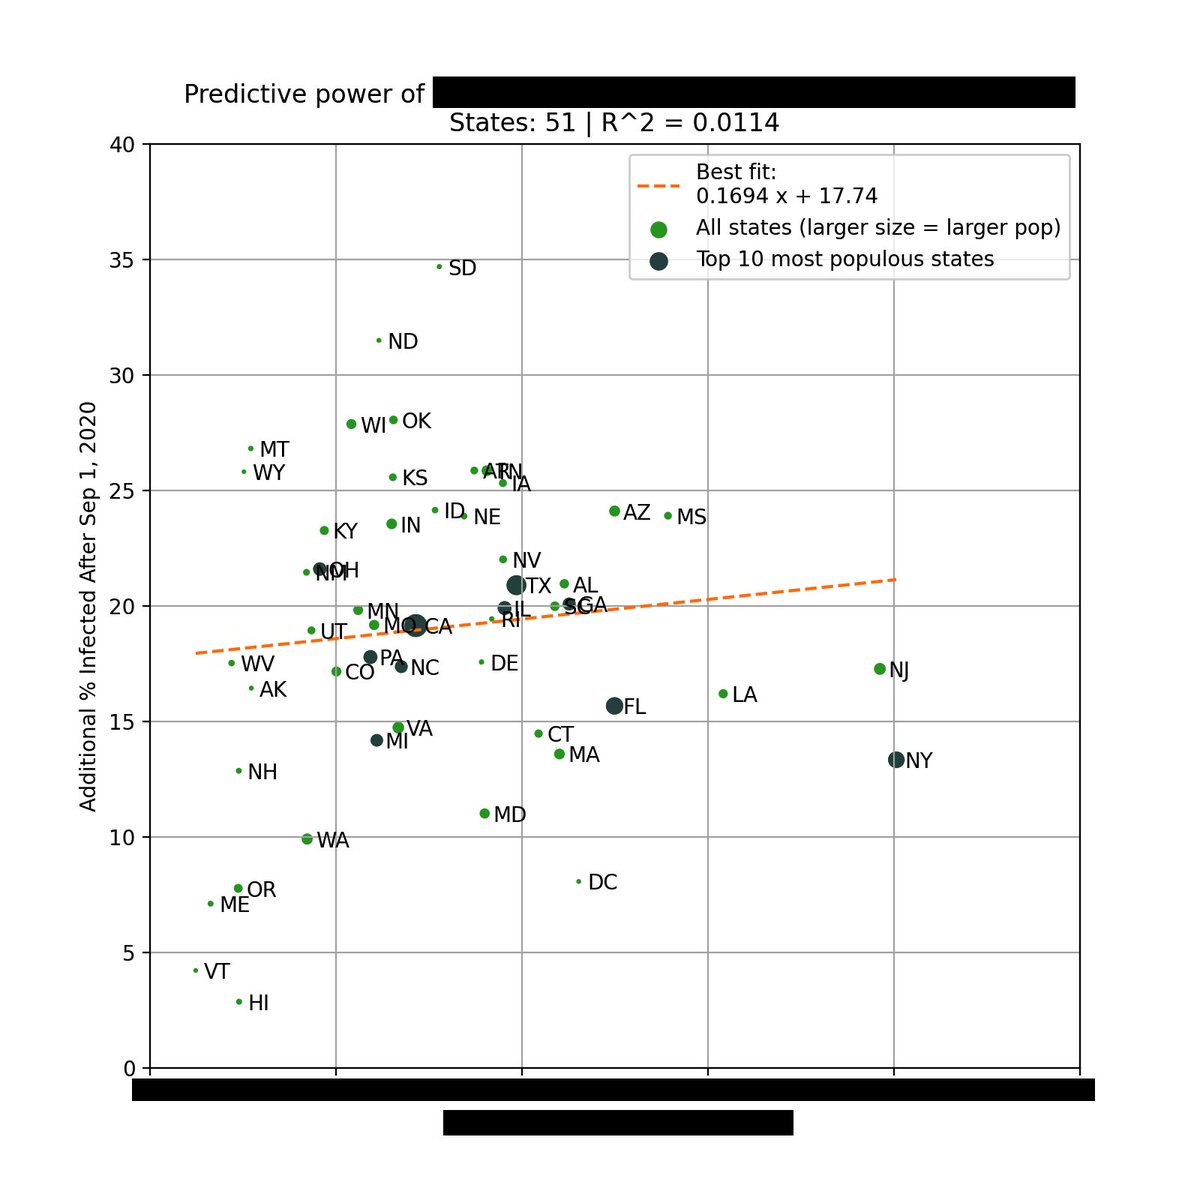
The left plot is based on the % infected through Sep 1, 2020. You can see that there is very little correlation with the % infected since Sep 1.
However, there is a *strong* correlation when using the margin of Biden's victory (right).
Infections % from https://t.co/WcXlfxv3Ah.

This is the strongest single variable I've seen in being able to explain the severity of this most recent wave in each state.
Not past infections / existing immunity, population density, racial makeup, latitude / weather / humidity, etc.
But political lean.
One can argue that states that lean Democrat are more likely to implement restrictions/mandates.
This is valid, so we test this by using the Government Stringency Index made by @UniofOxford.
We also see a correlation, but it's weaker (R^2=0.36 vs 0.50).
https://t.co/BxBBKwW6ta
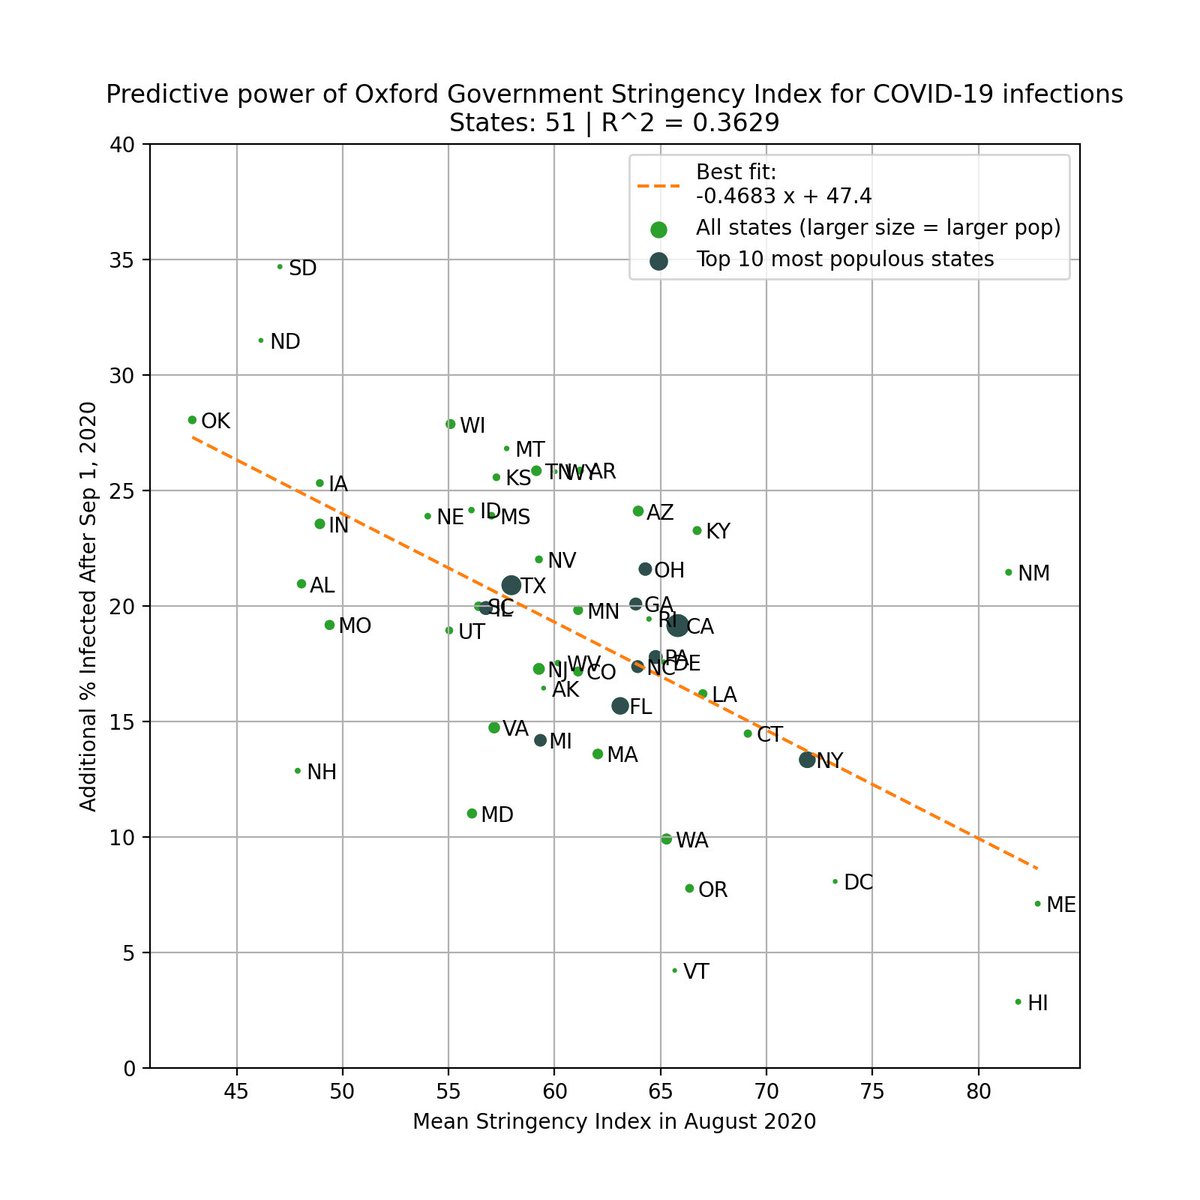
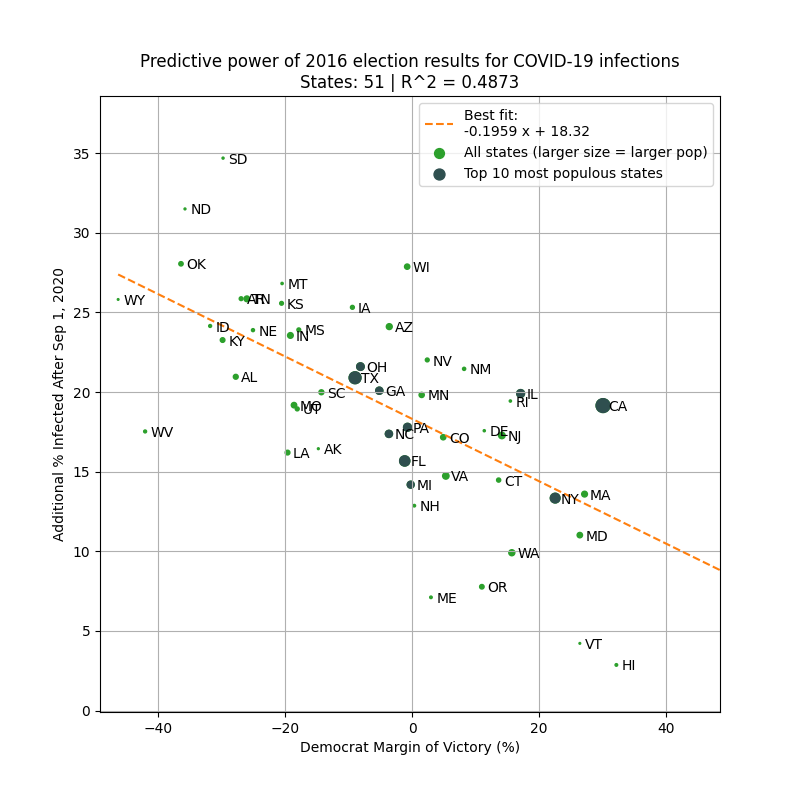
To avoid look-ahead bias/confounding variables, here is the same analysis but using 2016 margin of victory as the predictor. Similar results.
This basically says that 2016 election results is a better predictor of the severity of the fall wave than intervention levels in 2020!
1) Margin of Democrat victory in Nov 2020 election
or
2) % infected through Sep 1, 2020
Can you guess which plot is which?
The left plot is based on the % infected through Sep 1, 2020. You can see that there is very little correlation with the % infected since Sep 1.
However, there is a *strong* correlation when using the margin of Biden's victory (right).
Infections % from https://t.co/WcXlfxv3Ah.
This is the strongest single variable I've seen in being able to explain the severity of this most recent wave in each state.
Not past infections / existing immunity, population density, racial makeup, latitude / weather / humidity, etc.
But political lean.
One can argue that states that lean Democrat are more likely to implement restrictions/mandates.
This is valid, so we test this by using the Government Stringency Index made by @UniofOxford.
We also see a correlation, but it's weaker (R^2=0.36 vs 0.50).
https://t.co/BxBBKwW6ta
To avoid look-ahead bias/confounding variables, here is the same analysis but using 2016 margin of victory as the predictor. Similar results.
This basically says that 2016 election results is a better predictor of the severity of the fall wave than intervention levels in 2020!