While all indicators plot, it's always good to know the background.
Concept of Standard Deviation, simplified.

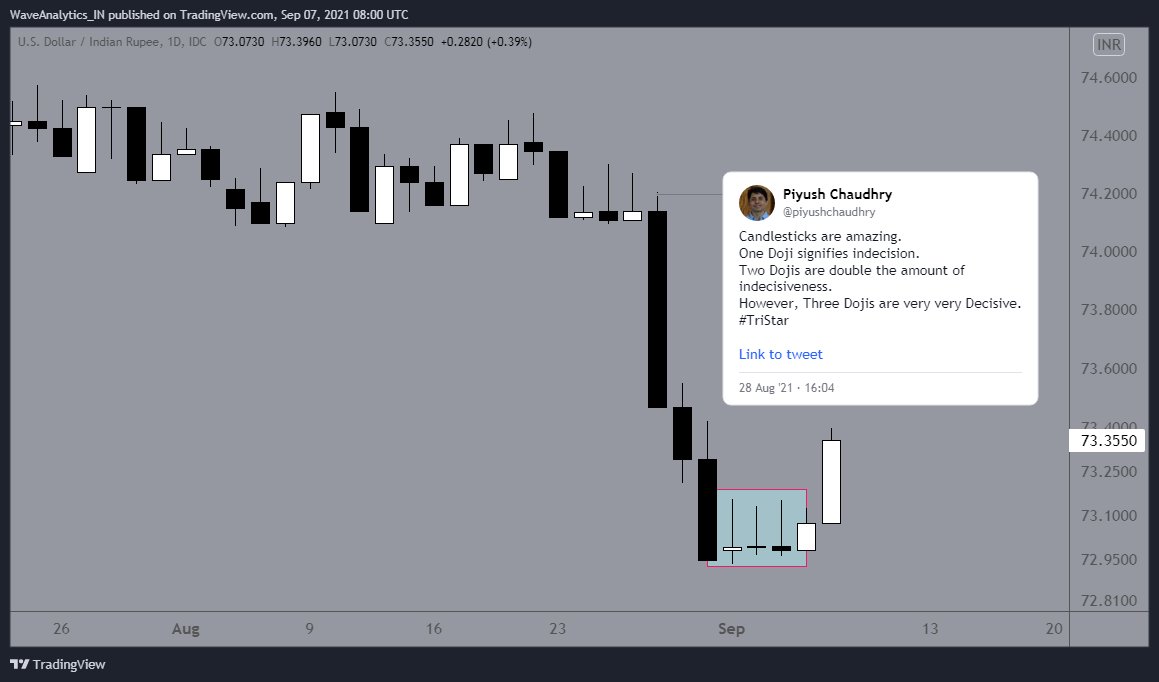
More from Piyush Chaudhry
Gaps and Probabilities.
A 2019 Tweet.
A 2019 Tweet.
#GapTheory - Do the Gaps get filled?
— Piyush Chaudhry (@piyushchaudhry) March 12, 2019
As per Thomas Bulkowski's 2005 study Odds for filling of the following Gaps -
Common Gaps: >70%
However,
Breakaway Gaps: <5%
Runaway Gaps: <20%
Exhaustion Gaps: >70%
Categorize the Gaps correctly and Look for Counter Signals.


More from Genericlearnings


Perhaps you have the idea that calling me " 1 lot Nandy" is somehow derogatory and a easy poke at me. Allow me to explain why I look at this moniker as a badge of honour
I have traded 1 lot continuously twice in my life. The first in 2003 after I blew up on my INFY trade. I traded 1 lot ACC fut consistently and made 50k in a month
The 2nd time in 2013. When I suffered continuous losses for 5-6 months due to a variety of psychological issues. Then I traded 1 lot Nifty options consistently for 3 months. After that 2 lots for next 1 month and slowly increased
I have shared these two incidents on my various interveiws and regularly share this in detail with my handholding students when I talk about trading psychology.
This logic of trading 1 lot to iron out trading issues I learnt from the interview of Anthony Saliba, who traded 1 lot in options for 6 months. BTW, Saliba was the only options trader to have been profiled on the original Market Wizards ( I read his interview and used his logic)
Sir itseems people call you as "one lot Nandy".. Is it true?
— Bittu (@nanoobittu) July 16, 2021
I have traded 1 lot continuously twice in my life. The first in 2003 after I blew up on my INFY trade. I traded 1 lot ACC fut consistently and made 50k in a month
The 2nd time in 2013. When I suffered continuous losses for 5-6 months due to a variety of psychological issues. Then I traded 1 lot Nifty options consistently for 3 months. After that 2 lots for next 1 month and slowly increased
I have shared these two incidents on my various interveiws and regularly share this in detail with my handholding students when I talk about trading psychology.
This logic of trading 1 lot to iron out trading issues I learnt from the interview of Anthony Saliba, who traded 1 lot in options for 6 months. BTW, Saliba was the only options trader to have been profiled on the original Market Wizards ( I read his interview and used his logic)