
If the connotation of risk is an intertwined concept and is difficult to quantify, how does a Risk Officer look at it?
Is there any way other than using copula models to determine systemic risk with long tails or a black swan event?
@CQFInstitute @GARP_Risk @SOActuaries
•75- 80% of the loss given events are classified as Operational #LGE - (LOSS GIVEN EVENTS),
•Only 15%- 20% of the LGEs are driven by Market or Credit or both
#Risk managers can use #scenario #analysis based on an expert judgement, that can be more helpful, instead of applying #VaR models blindly.
The Financial Markets outcomes are not Normal or i.i.d in any sense.
Gaussian Copula model assumes that correlation (strength of association between x and y variables) is Linear and hence presents the symmetric perspective of market-driven loss events.
@BIS_org
But that didn't work out well using symmetric event modelling assumptions!
A #Poisson Probability Distribution Model to measure frequency, whereas stochastic simulation can be used to measure severity for each single event loss.
The most common assumption used is that loss severity is independent of loss frequency.
This Loss distribution model for e.g. in the context of a Hedge Fund?
Can we induce randomness into the experiment to better capture heavy loss incurring tailed events aka Black Swan Events (having high severity and low frequency)?
2. Sample nnn times from the loss severity distribution to determine the loss experienced for each loss event (L1, L2,…,Ln)
Kindly refer to the same BASEL II - ORM Taxonomy as laid down in Basel II literature to better understand the vertical dependencies between various risk types/ across various lines
The following lists the seven official Basel II event types with some examples for each category:
1.Internal Fraud – misappropriation of assets, tax evasion, intentional mismarking of positions, bribery
3.Employment Practices and Workplace Safety – discrimination, workers compensation, employee health and safety
5.Damage to Physical Assets – natural disasters, terrorism, vandalism
7.Execution, Delivery, and Process Management – data entry errors, accounting errors, failed mandatory reporting, negligent loss of client assets
To better comprehend hedge fund business complexity you need to have a proper FMEA (Failure Modes and Effect Analysis) ....
Management that is a classic problem observed in the #FRM Profession, just because it is difficult to do quantitative modelling.
More from Finance


** MEGA THREAD ON Cryptocurrencies/Blockchain**
I wanted to know the best resources to learn about cryptocurrencies and blockchain for someone with zero knowledge. I asked Twitter, and Twitter answered.
This thread is a compilation of the best resources I was recommended. 👇👇
Let's start with ** BOOKS **
The first thing you should do before you pick up any book:
Learn about Bitcoin & Ethereum by reading the respective whitepapers.
- [Bitcoin white paper](https://t.co/cErOaFn6QL) by Satoshi Nakamoto
- [Ethereum White paper] (https://t.co/0g5kYCGJGq) by Vitalik Buterin
Even if you are not tech savvy, you can get a good grasp about how blockchain functions from these papers.
1) *The Basics of Bitcoins and Blockchains: An Introduction to Cryptocurrencies and the Technology that Powers Them* by Antony Lewis
This book covers topics such as the history of Bitcoin, the Bitcoin blockchain, and Bitcoin buying, selling, and mining.
It also answers how payments are made and how transactions are kept secure.
Other cryptocurrencies and cryptocurrency pricing are examined, answering how one puts a value on cryptocurrencies and digital tokens.

Inflation is coming, inflation is coming!
Last month I wrote about the distinction between long-term secular inflation and shorter-term cyclical inflation
It has been clear for several months that we are in the middle of a cyclical rise in
The full thread can be reviewed here:
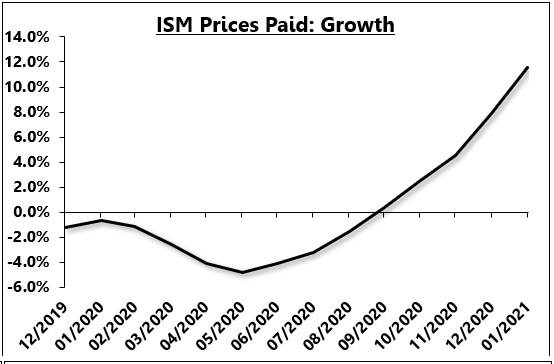
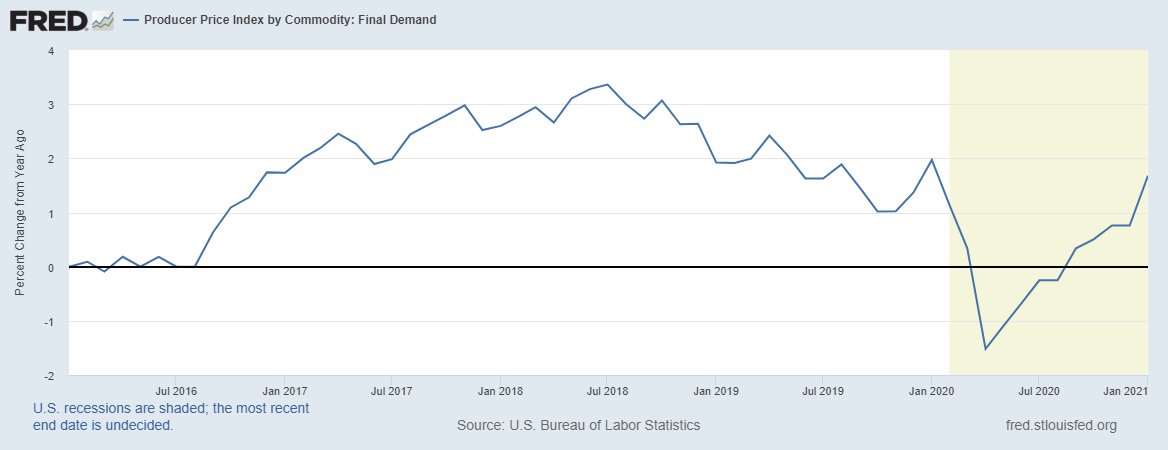
Today's PPI report should have been expected to surprise to the upside as the leading indicators of inflation have been screaming to the upside for months!
Here is the ISM prices paid index, cumulated into a growth rate
3/
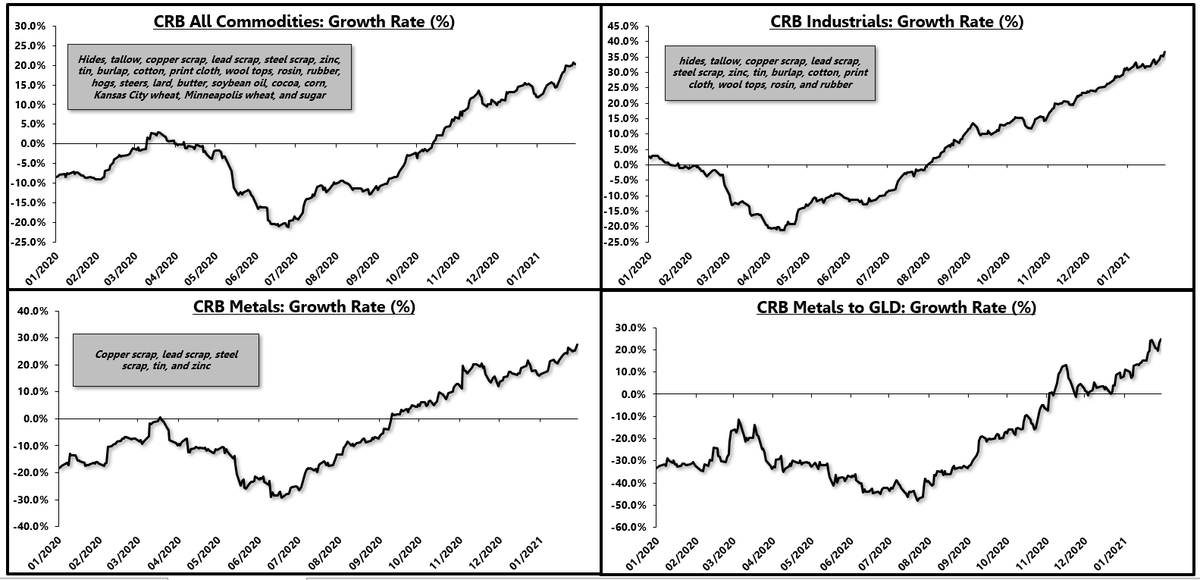
Industrial commodity prices have also seen a major acceleration for months.
4/
So today's PPI report was in line with the leads, suggesting that we have a cyclical upturn in inflation that is * primarily concentrated in the manufacturing sector *
This is a key point.
5/
Last month I wrote about the distinction between long-term secular inflation and shorter-term cyclical inflation
It has been clear for several months that we are in the middle of a cyclical rise in
Now, in the short-term, the manufacturing sector is red hot, driven by a pent-up demand rebound in goods consumption.
— Eric Basmajian (@EPBResearch) January 4, 2021
Commodity prices are screaming which gives legs to "goods" inflation in the short-term.
8) pic.twitter.com/rQcqHf1OD0
The full thread can be reviewed here:
Consensus continues to conflate the inflation story, mixing and matching long-term and short-term charts to fit what is generally a secular inflation narrative.
— Eric Basmajian (@EPBResearch) January 4, 2021
Here are my two cents to make the distinction clear.
1)
Today's PPI report should have been expected to surprise to the upside as the leading indicators of inflation have been screaming to the upside for months!
Here is the ISM prices paid index, cumulated into a growth rate
3/
Industrial commodity prices have also seen a major acceleration for months.
4/
So today's PPI report was in line with the leads, suggesting that we have a cyclical upturn in inflation that is * primarily concentrated in the manufacturing sector *
This is a key point.
5/
You May Also Like


Trading view scanner process -
1 - open trading view in your browser and select stock scanner in left corner down side .
2 - touch the percentage% gain change ( and u can see higest gainer of today)
3. Then, start with 6% gainer to 20% gainer and look charts of everyone in daily Timeframe . (For fno selection u can choose 1% to 4% )
4. Then manually select the stocks which are going to give all time high BO or 52 high BO or already given.
5. U can also select those stocks which are going to give range breakout or already given range BO
6 . If in 15 min chart📊 any stock sustaing near BO zone or after BO then select it on your watchlist
7 . Now next day if any stock show momentum u can take trade in it with RM
This looks very easy & simple but,
U will amazed to see it's result if you follow proper risk management.
I did 4x my capital by trading in only momentum stocks.
I will keep sharing such learning thread 🧵 for you 🙏💞🙏
Keep learning / keep sharing 🙏
@AdityaTodmal
1 - open trading view in your browser and select stock scanner in left corner down side .
2 - touch the percentage% gain change ( and u can see higest gainer of today)
Making thread \U0001f9f5 on trading view scanner by which you can select intraday and btst stocks .
— Vikrant (@Trading0secrets) October 22, 2021
In just few hours (Without any watchlist)
Some manual efforts u have to put on it.
Soon going to share the process with u whenever it will be ready .
"How's the josh?"guys \U0001f57a\U0001f3b7\U0001f483
3. Then, start with 6% gainer to 20% gainer and look charts of everyone in daily Timeframe . (For fno selection u can choose 1% to 4% )
4. Then manually select the stocks which are going to give all time high BO or 52 high BO or already given.
5. U can also select those stocks which are going to give range breakout or already given range BO
6 . If in 15 min chart📊 any stock sustaing near BO zone or after BO then select it on your watchlist
7 . Now next day if any stock show momentum u can take trade in it with RM
This looks very easy & simple but,
U will amazed to see it's result if you follow proper risk management.
I did 4x my capital by trading in only momentum stocks.
I will keep sharing such learning thread 🧵 for you 🙏💞🙏
Keep learning / keep sharing 🙏
@AdityaTodmal


