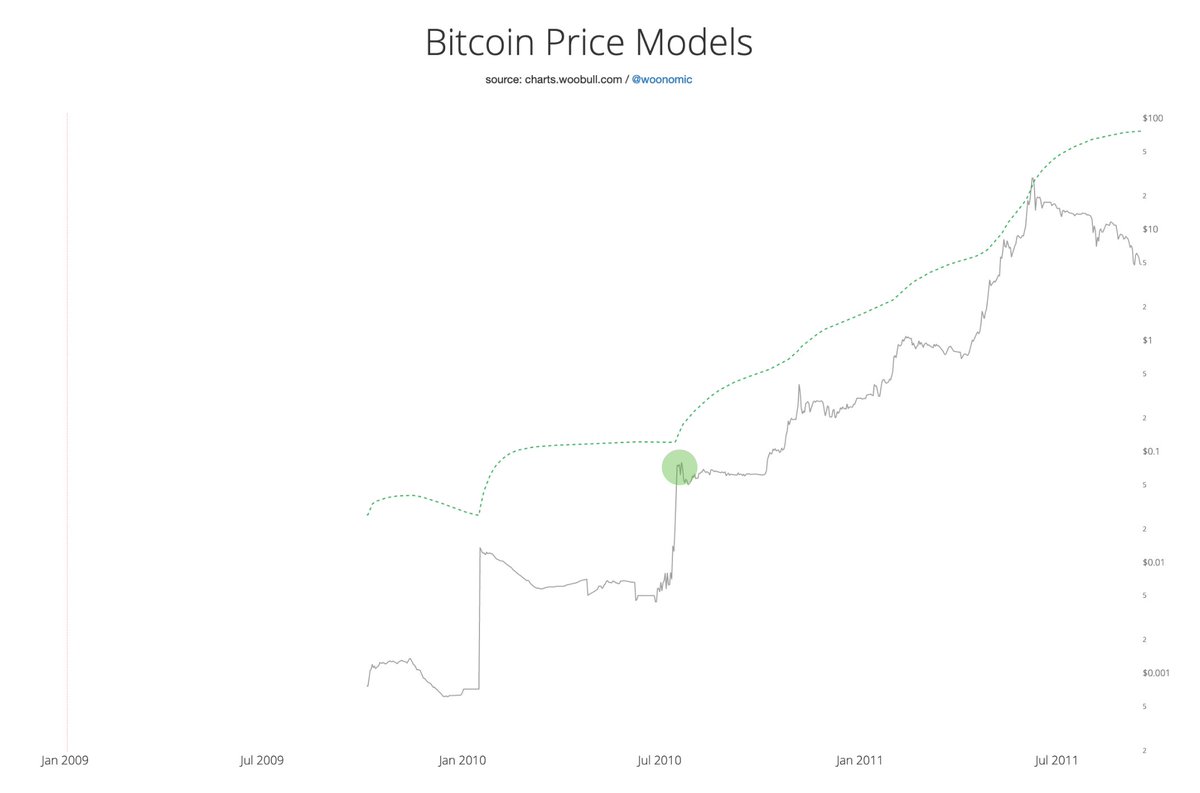
Let me indulge in a story...
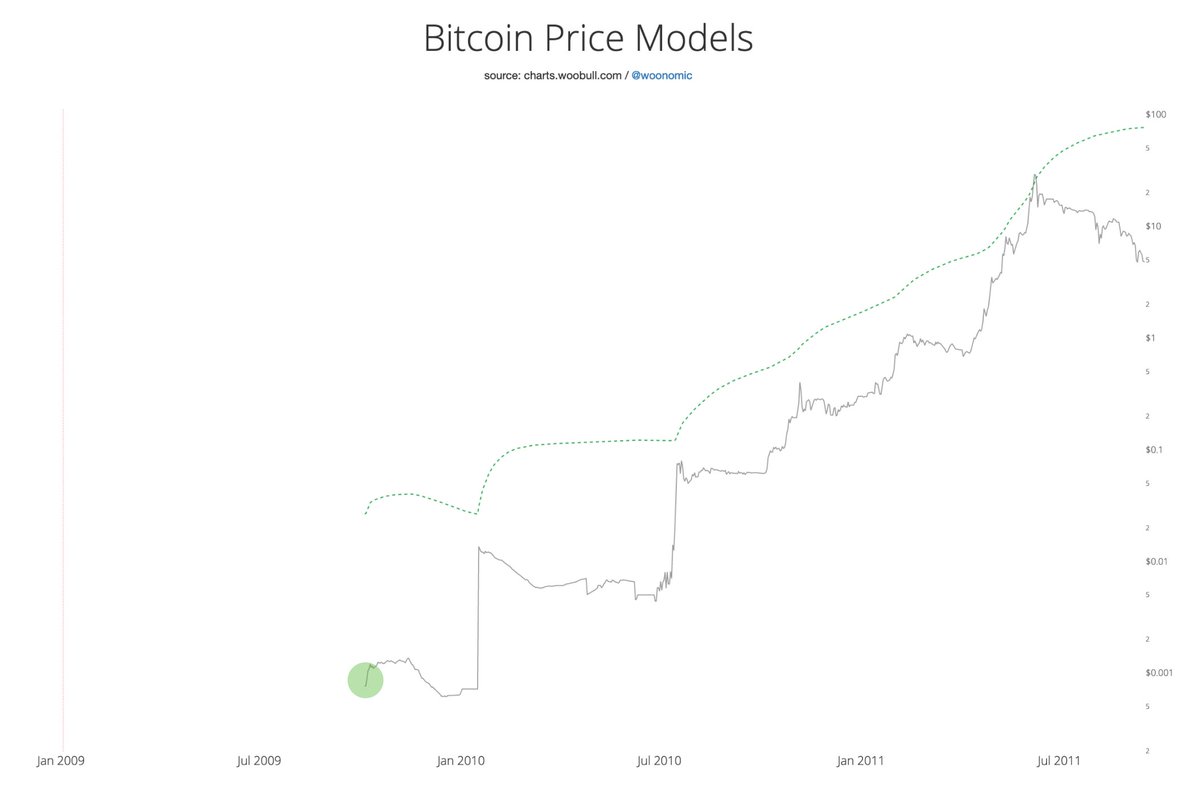
Once upon a time there was a genius called Satoshi, this anonymous character laid down a block, it was called the Genius Block, but we we spell it wrong to this day.
Then along came your standard noob who believed in freedom, we know this because he went by the name NewLibertyStandard.
He created a site to buy and sell Bitcoins.
On his site, he priced Bitcoin on electricity.
The price went up, the price went down.
Then one day, he changed the pricing system.
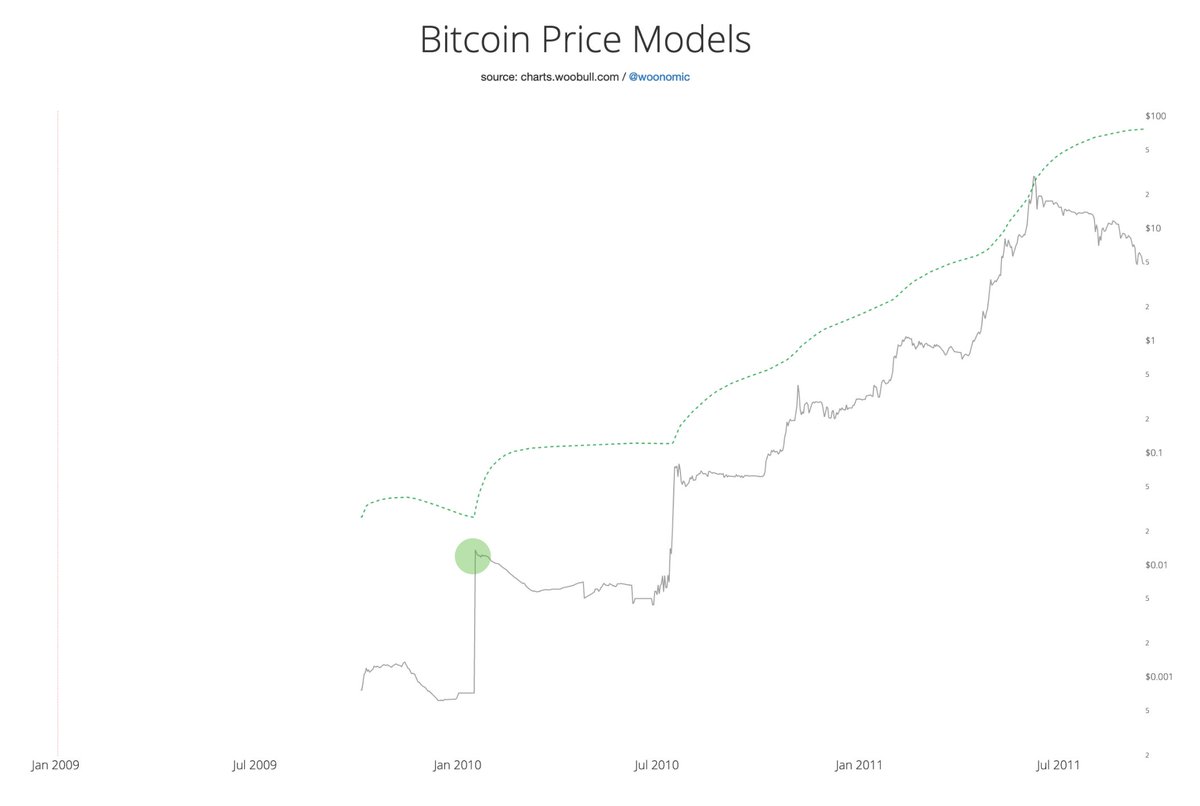
BTC was no longer priced at the cost of mining.
He priced it by DEMAND and SUPPLY.
Geeks and legendary futurists, bought and sold the rarest commodity on the Internet for pennies.
Price teleported upwards.
Then came a Magic The Gathering gamer. He smashed together a shaky piece of software called Magic The Gathering Exchange.
It became the first widely used BTC exchange.
The whole world sent this kid money to buy BTC.
A new market had unlocked. Price teleported.
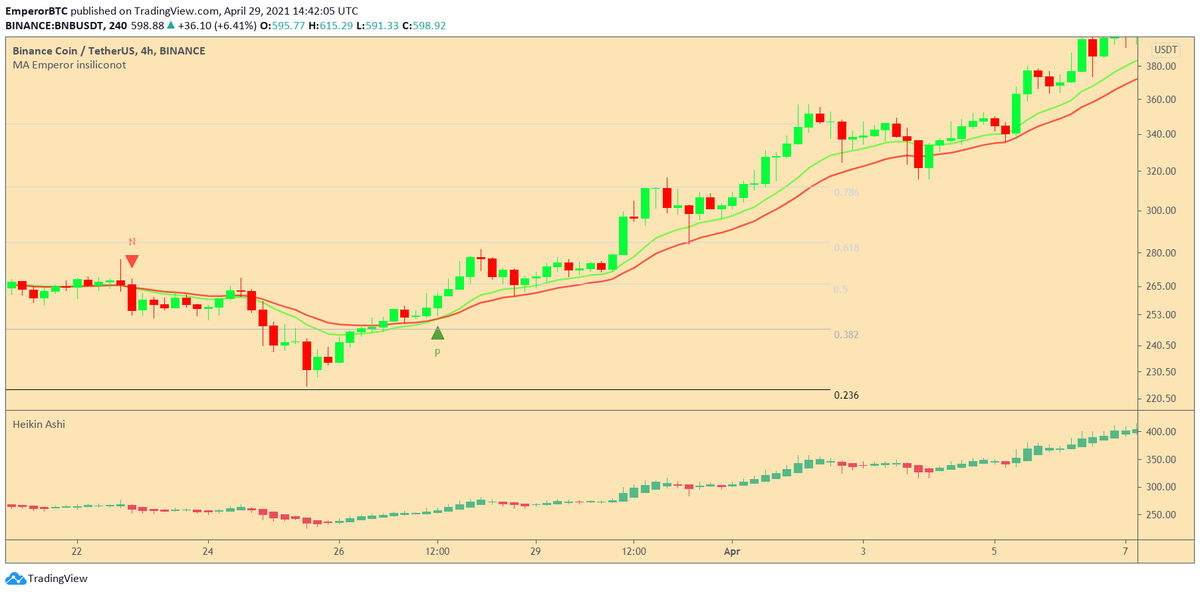
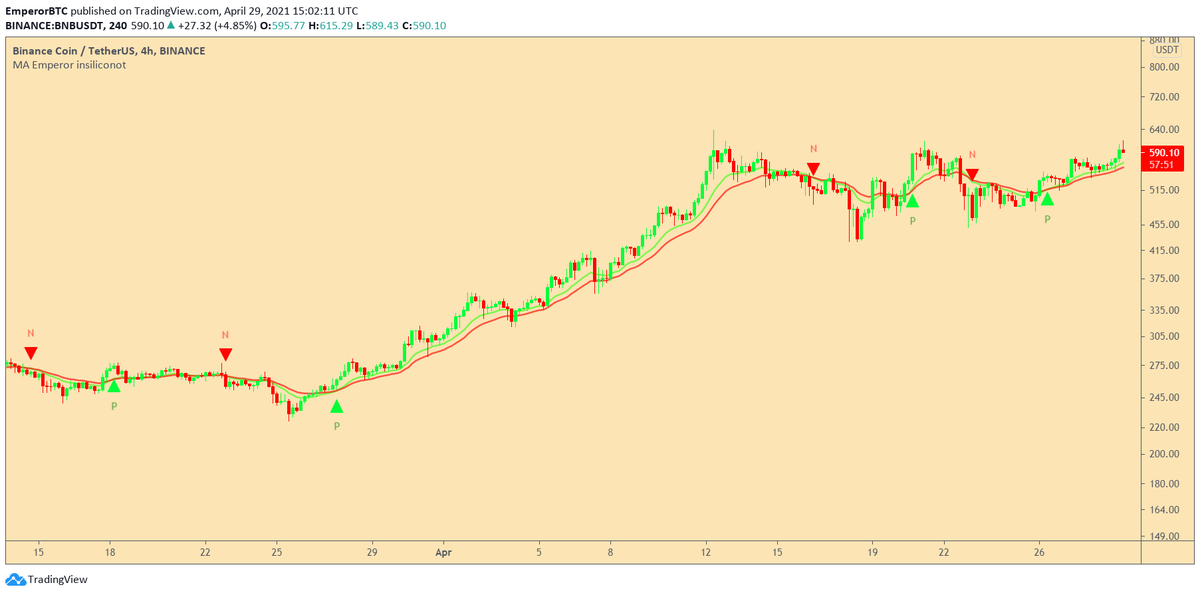
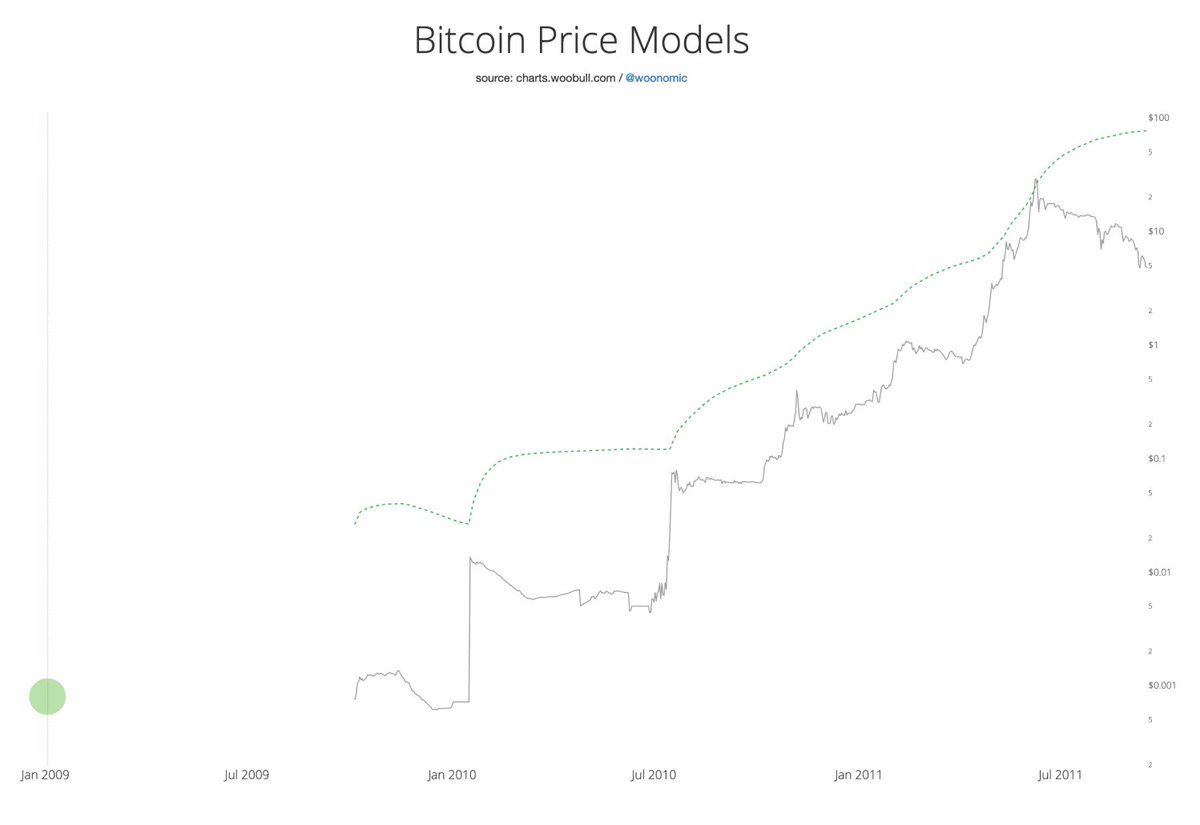
Let's fast forward 6 glorious years of price teleportation events.
Many of the story details remain unknown to me, though I see their impact on the blockchain.
But let me bring you to the year 2017 and save you lots of reading...