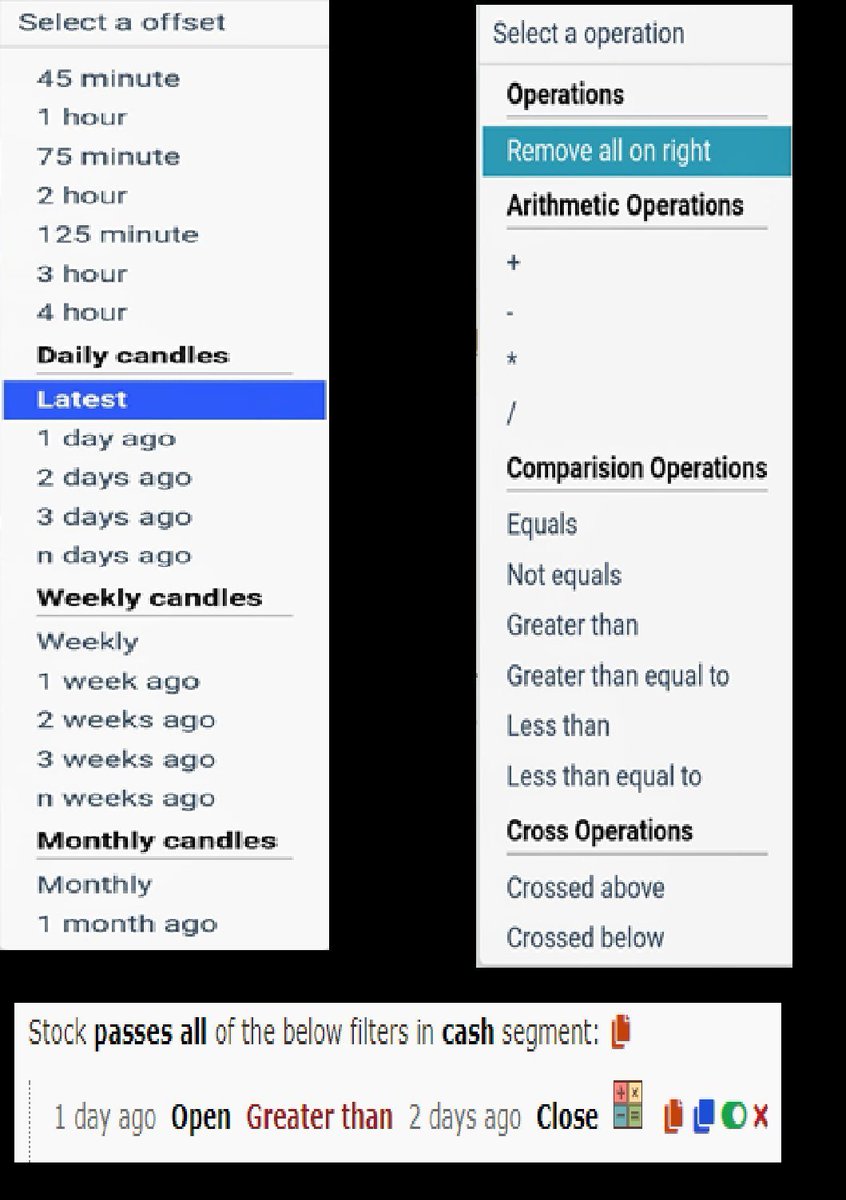
🔸 It scans stocks by using technical indicators like RSI, MACD, divergences, etc.
🔸 It also uses fundamental tools like Book Value, EPS,PE etc
[2/15]


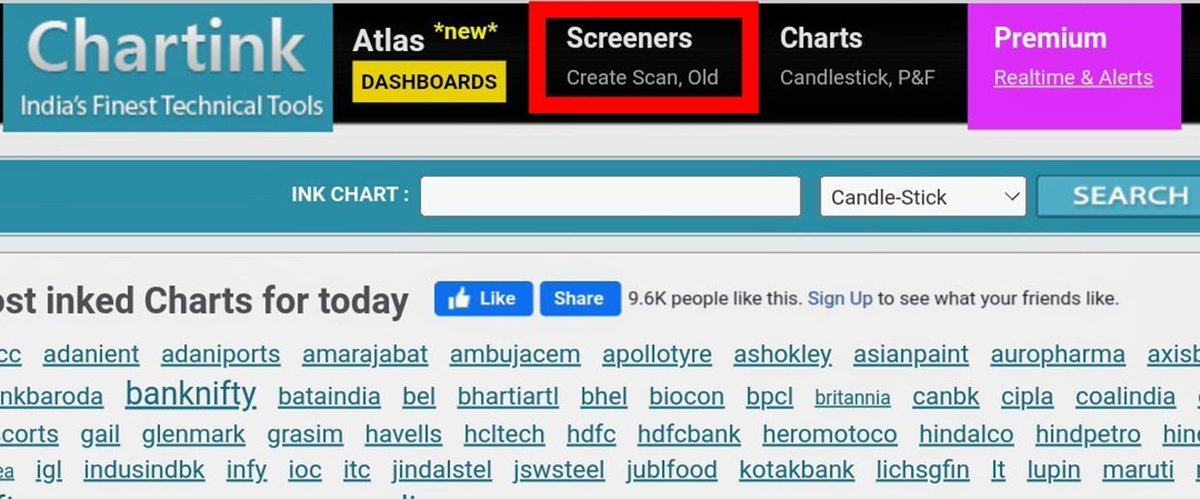
Chartink Screeners Complete Compilation
— JayneshKasliwal (@JayneshKasliwal) March 25, 2022
Sharing 9 Screeners\U0001f9f5
1. Swing Trading Techno Funda https://t.co/sV6e8XSFRK
2.Range Breakout https://t.co/SNKEpGHNtv
3. Stocks in Tight Range :https://t.co/MqDFMEfj82
Telegram Link : https://t.co/b4N4oPjqm9
Retweet and Share !

"I really want to break into comics"
— Ed Brisson (@edbrisson) December 4, 2018
make comics.
"If only someone would tell me how I can get an editor to notice me."
Make Comics.
"I guess it's impossible and I'll never break into the industry."
MAKE COMICS.