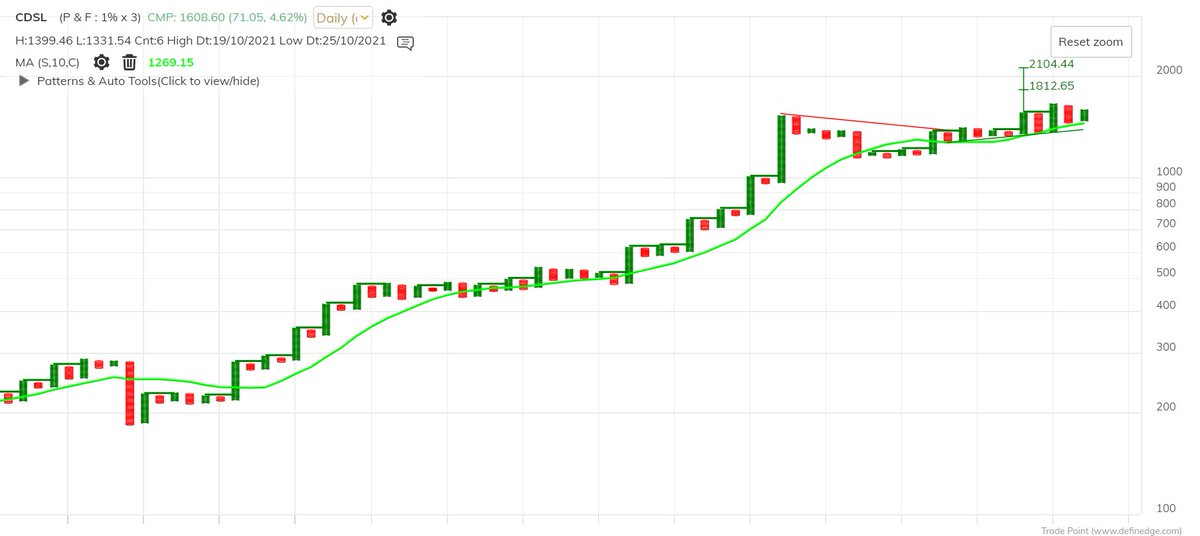
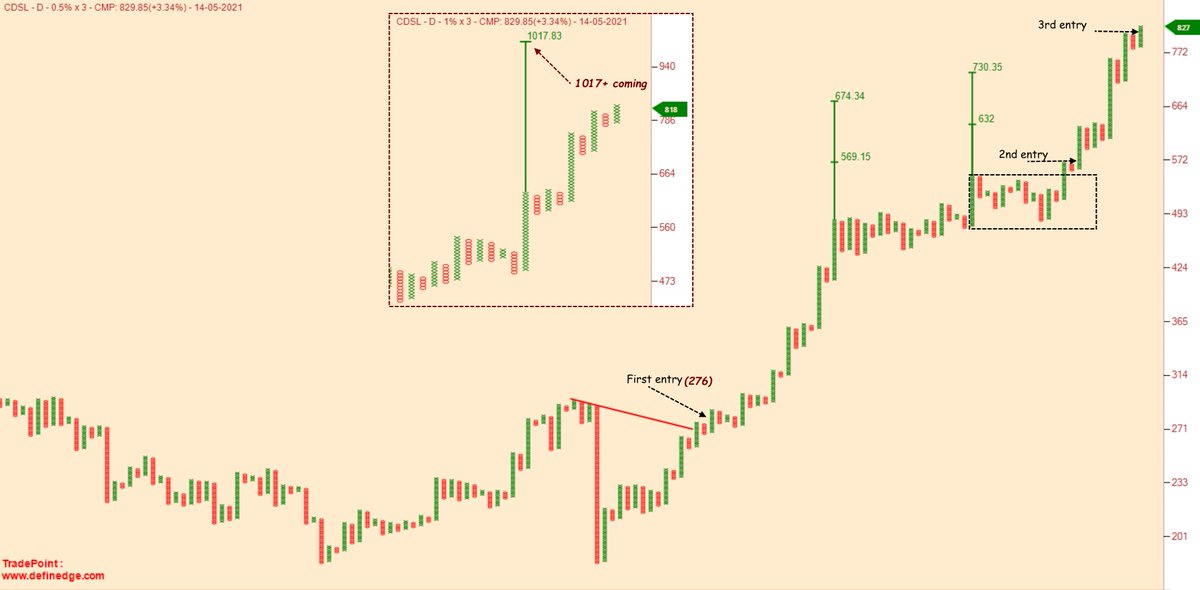
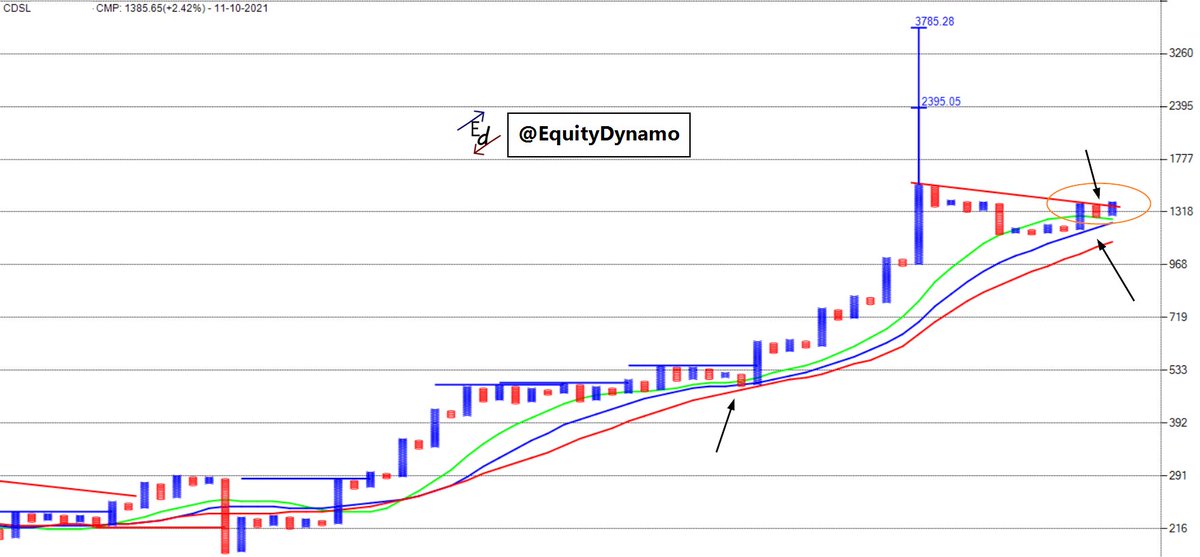
#CDSL beautiful company with nice uptrending price chart.....45%ROI in 54 trading days since first post ....#TrendFollowing #Pyramiding #AveragingUp ... https://t.co/25hh9QKamu
#CDSL another holding from lower levels...now looks ready for further northward journey.... #TechnoFundaPick #ADB pic.twitter.com/A3cjRV94Ew
— Akaash (@thepnfway) February 19, 2021
More from Akaash


More from Cdsl


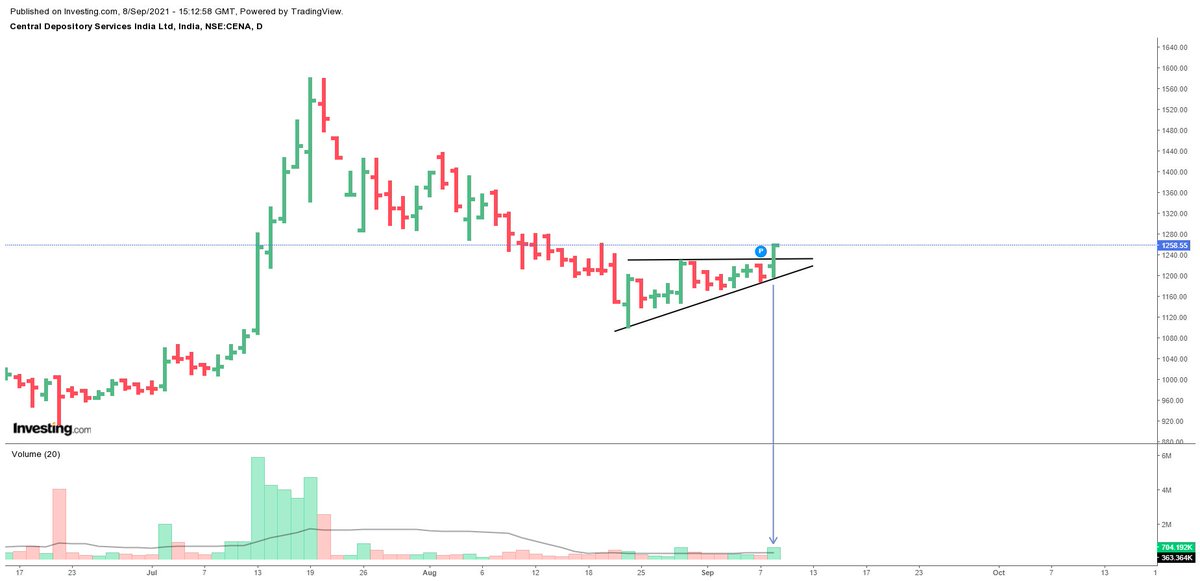
#PORTFOLIO UPDATE
CDSL
CMP: 1258.55
One of my long term PORTFOLIO STOCK is getting ready for the next phase.
Will be a good point to add more quantity. https://t.co/KaidnjSWpY
CDSL
CMP: 1258.55
One of my long term PORTFOLIO STOCK is getting ready for the next phase.
Will be a good point to add more quantity. https://t.co/KaidnjSWpY
A lot of friends ask for stocks that they can invest for next 5 years. I personally believe and personally invested into
— TECHVESTOR (@AshrafZaman3) May 23, 2021
1. IEX
2 CDSL
3. IRCTC
4. NAZARA TECHNOLOGIES
Please do not take this as an investment recommendation. Also my entry price is lower.#investing pic.twitter.com/vKBLV9u4mL