Coming Sunday - 3 Hours FREE webinar.
PRICE ACTION TRADING for Option Buyers,Sellers & Future traders.
Interested traders follow the below 2 steps
1) RETWEET
2) FOLLOW us on Twitter (Twitter will allow to send message only once you follow)
Link will be shared via Twitter DM
More from Learn to Trade
A mega thread 🧵on various content related to trading
1/11 🧵
Retweet and share to benefit maximum traders
Checklist for Option buying thread by ( @asitbaran )
2/11
A thread on Basic Checklist while going Long Options.
— Asit Baran Pati \U0001f1ee\U0001f1f3 (@asitbaran) May 24, 2021
Thought of writing this post for people who are doing Option Buying and losing money. It can be very basic, so Pros please may give a skip.
Just a checklist so that you don\u2019t lose big money by Long Option strategies
Trading via spread by @Ronak_Unadkat complied by @AdityaTodmal
3/11
The best spreads trader on Twitter: @Ronak_Unadkat
— Aditya Todmal (@AdityaTodmal) March 6, 2022
He trades in Nifty & Bank Nifty via spreads majorly.
In the Jainam Broking Speech, he shared how he trades debit and credit spreads:
Here's a breakdown of his 10 step method: \U0001f9f5
Collaborated with @niki_poojary
Option strike price selection by @ITRADE191 complied by @AdityaTodmal
4/11
A THREAD on . . . .
— Aditya Todmal (@AdityaTodmal) March 29, 2021
How @ITRADE191 selects strikes to trade in and how he follows risk management.
Short thread explained via pictures with the help of @niki_poojary.
Data points to check as a option sellers by @kapildhama
5/11
2 hours of non-stop Twitter space by @kapildhama
— Learn to Trade (@learntotrade365) January 17, 2022
Topic - Data Points to check as a Option seller
Mega Thread \U0001f9f5 of all the data points to check as a option seller shared by Mr. Kapil Dhama is complied
Retweet to reach wider -Learning should never stop#StockMarketindia
1/18 https://t.co/m0NXToSU1p pic.twitter.com/GkjArctHsR
25 HOLY GRAIL steps to become INDEPENDENT & successful in trading
It will take 3 to 5 minutes to read
Game changing trading Thread 🧵
Support us by Retweet to reach and benefit maximum traders
Happy Independence day to everyone
— Learn to Trade (@learntotrade365) August 15, 2022
Real independence is spreading positivity, staying calm & always be happy in up & down pic.twitter.com/5J5eXTiJgJ
1. Trading is a business were first we have to believe in ourselves and have a fearless mindset with calculated risk.
2. Don't risk more than 1 to 2% of your capital on a single trading session or per trade.(This one simple rule will first help us to stop losing big)
Scroll 👇
3. Skill or business can't be developed overnight or in few weeks so first stop praying or searching for some magic strategy to make lakhs/crores overnight or in few months
4. Fear can stop us from growth so don't think of the outcome ( Profit or loss )- Scroll down👇
follow the process & execute trades with clarity and confidence
5. Process is about having a trade plan , following few trading strategy more than 1000 times with risk & position size in control. Fear develops only when we can't handle or see big mtm swing
Scroll down 👇
6. We trade in the market to make money so it's nothing wrong to start trading with 1 lot or 2 lot etc... Start small and make it big.
But most do reverse starting big and after huge losses trading small- Here FEAR factor has took full control of your trading
Scroll down👇
For Option Buyers, Option Sellers & all Directional traders
Simple strategy help to make more profits
Retweet this thread 🧵 to reach many traders

I also do Intraday Live Market sessions on all Trading days ( Monday to Friday 09:00 a.m to 01:00 p.m) - Follow us @learntotrade365
Join the Telegram channel - https://t.co/VU0bCGAX9s
Scroll down 👇
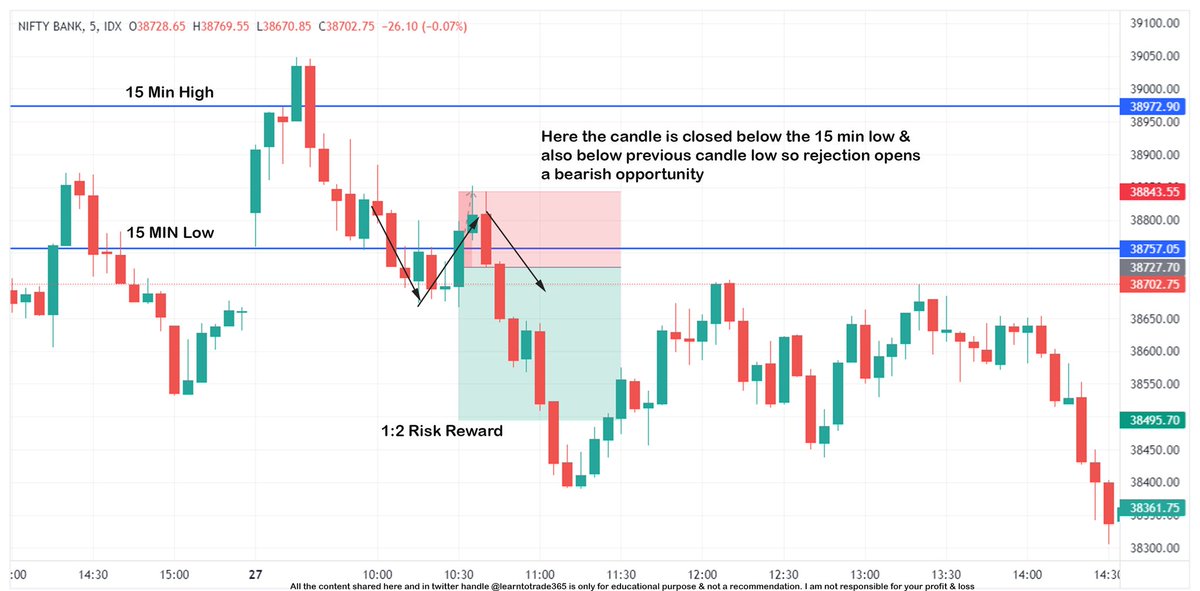
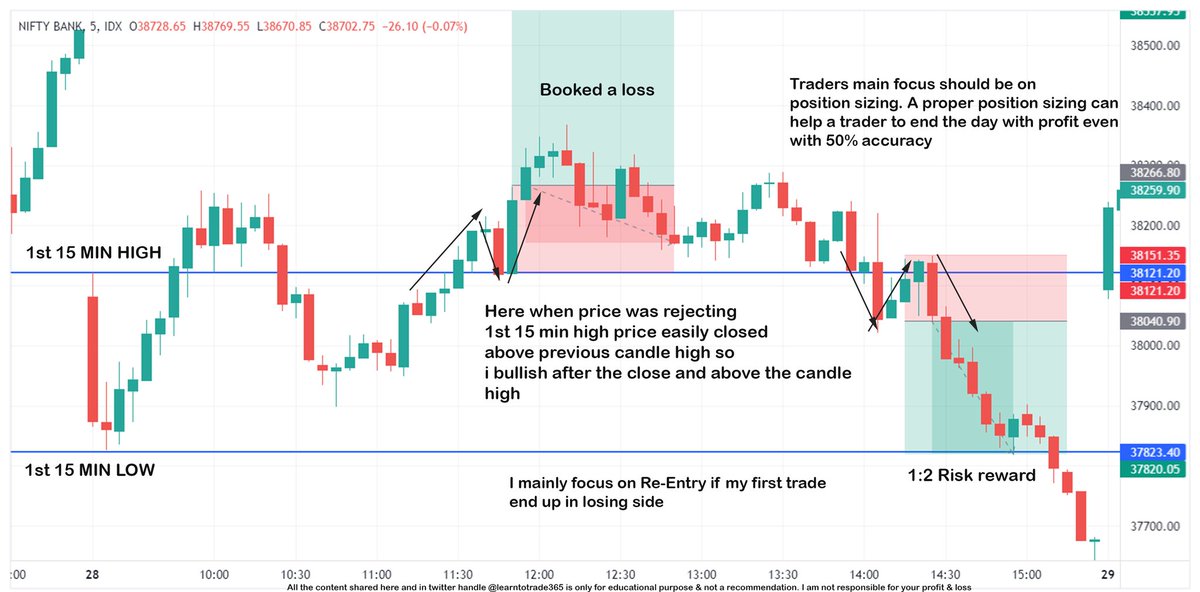
My approach here is to focus on Low risk High Reward strategy with simple 1st 15 Minutes High & Low. You can personally do your testing.
Chart 1 Scroll down 👇
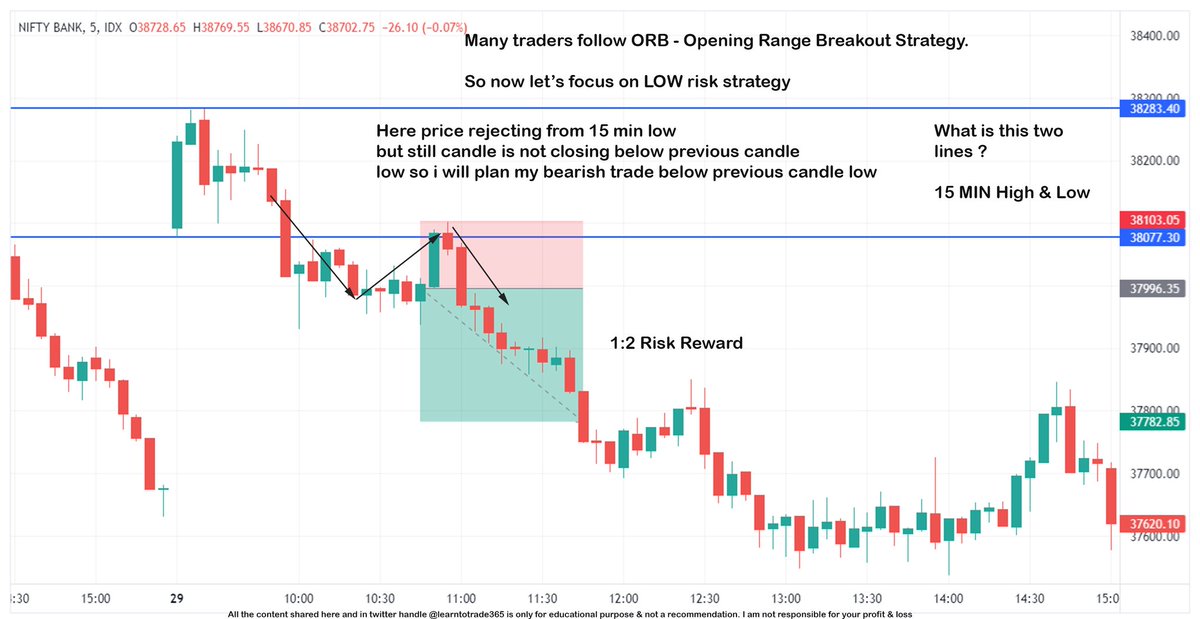
Trading involves both profit & loss. But still becoming a profitable traders is a skill of proper position sizing. Good position sizing is fix your losses and taking quantity according to the STOPLOSS
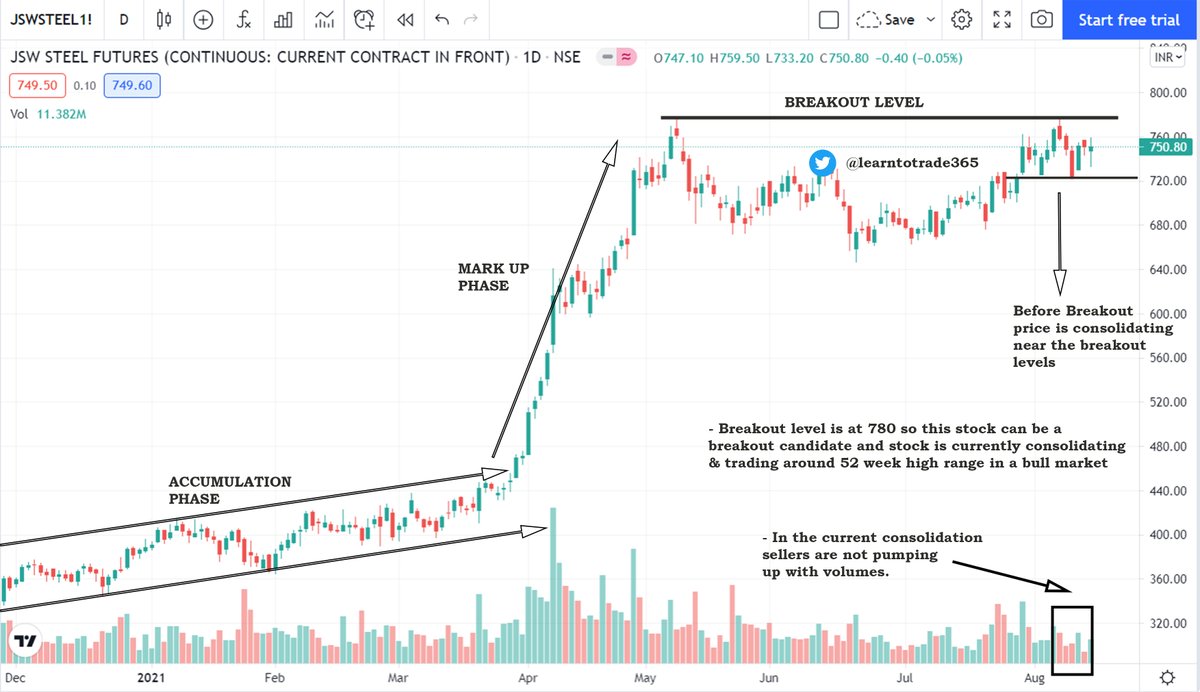
Chart -2 Scroll down👇
Everyone want to make money from trading but ultimately traders who's main focus is on following the PRICE with risk management end up making big money from trading
Focus on Price. Rest is Noise
Chart 3 Scroll down 👇