
10 Powerful Lessons of the book “The Art of Thinking Clearly”
| Thread 🧵

It is a tendency to interpret new information so that it becomes compatible with our existing theories.
Dis-confirming evidence must be seeked out to beat this theory.
He or she will not be the most popular member of the team, but definitely the most important.
Send an email to 10,000 people with stock market prediction by dividing them into 2 groups - telling reverse prediction to each group. Prediction for one of the groups will come true.
The fear of losing something motivates people more than the prospect of gaining something of equal value.
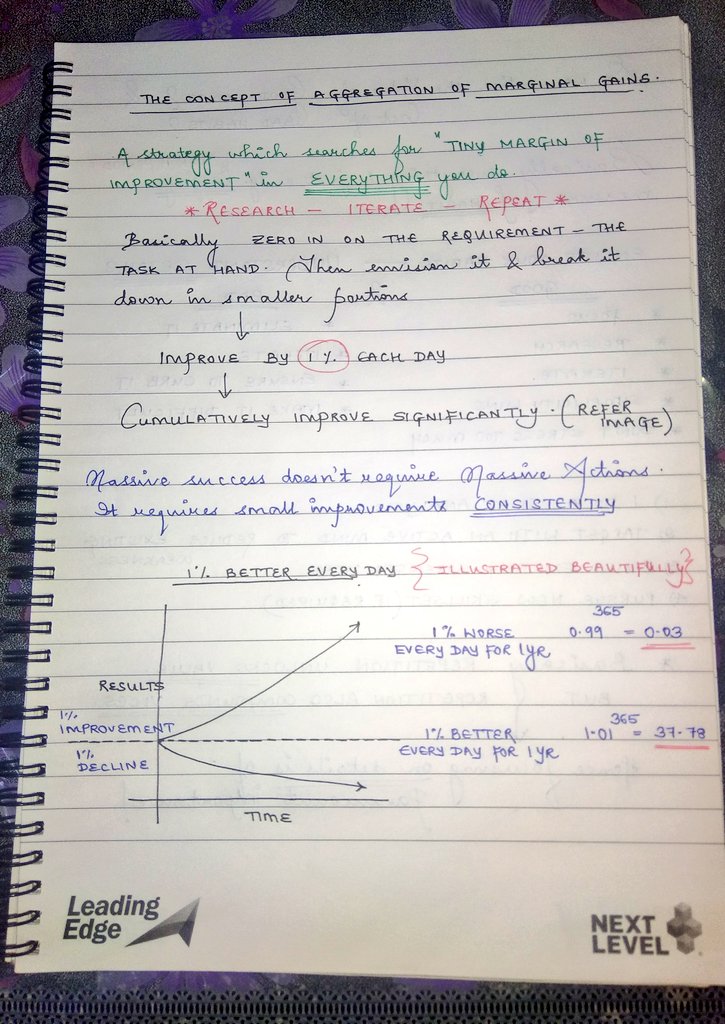
When it comes to compounding, dont trust your intuition - you have no idea how powerful it is.
99% Fat Free product seems more healthy than a product with 1% Fat.
There is no 3rd category of passive onlookers.
A Bill Gates monthly income in a group of 50 ordinary citizens can give an extremely misleading average.
And retweet the first tweet to share with others:
https://t.co/QYlZjIAGMD
10 Powerful Lessons of the book \u201cThe Art of Thinking Clearly\u201d
— Andrew Duggan (@ajdduggan) March 9, 2022
| Thread \U0001f9f5 pic.twitter.com/XzxUpBJGEL
More from Andrew Duggan


More from Books


You May Also Like


So the cryptocurrency industry has basically two products, one which is relatively benign and doesn't have product market fit, and one which is malignant and does. The industry has a weird superposition of understanding this fact and (strategically?) not understanding it.
The benign product is sovereign programmable money, which is historically a niche interest of folks with a relatively clustered set of beliefs about the state, the literary merit of Snow Crash, and the utility of gold to the modern economy.
This product has narrow appeal and, accordingly, is worth about as much as everything else on a 486 sitting in someone's basement is worth.
The other product is investment scams, which have approximately the best product market fit of anything produced by humans. In no age, in no country, in no city, at no level of sophistication do people consistently say "Actually I would prefer not to get money for nothing."
This product needs the exchanges like they need oxygen, because the value of it is directly tied to having payment rails to move real currency into the ecosystem and some jurisdictional and regulatory legerdemain to stay one step ahead of the banhammer.
If everyone was holding bitcoin on the old x86 in their parents basement, we would be finding a price bottom. The problem is the risk is all pooled at a few brokerages and a network of rotten exchanges with counter party risk that makes AIG circa 2008 look like a good credit.
— Greg Wester (@gwestr) November 25, 2018
The benign product is sovereign programmable money, which is historically a niche interest of folks with a relatively clustered set of beliefs about the state, the literary merit of Snow Crash, and the utility of gold to the modern economy.
This product has narrow appeal and, accordingly, is worth about as much as everything else on a 486 sitting in someone's basement is worth.
The other product is investment scams, which have approximately the best product market fit of anything produced by humans. In no age, in no country, in no city, at no level of sophistication do people consistently say "Actually I would prefer not to get money for nothing."
This product needs the exchanges like they need oxygen, because the value of it is directly tied to having payment rails to move real currency into the ecosystem and some jurisdictional and regulatory legerdemain to stay one step ahead of the banhammer.

"I really want to break into Product Management"
make products.
"If only someone would tell me how I can get a startup to notice me."
Make Products.
"I guess it's impossible and I'll never break into the industry."
MAKE PRODUCTS.
Courtesy of @edbrisson's wonderful thread on breaking into comics – https://t.co/TgNblNSCBj – here is why the same applies to Product Management, too.
There is no better way of learning the craft of product, or proving your potential to employers, than just doing it.
You do not need anybody's permission. We don't have diplomas, nor doctorates. We can barely agree on a single standard of what a Product Manager is supposed to do.
But – there is at least one blindingly obvious industry consensus – a Product Manager makes Products.
And they don't need to be kept at the exact right temperature, given endless resource, or carefully protected in order to do this.
They find their own way.
make products.
"If only someone would tell me how I can get a startup to notice me."
Make Products.
"I guess it's impossible and I'll never break into the industry."
MAKE PRODUCTS.
Courtesy of @edbrisson's wonderful thread on breaking into comics – https://t.co/TgNblNSCBj – here is why the same applies to Product Management, too.
"I really want to break into comics"
— Ed Brisson (@edbrisson) December 4, 2018
make comics.
"If only someone would tell me how I can get an editor to notice me."
Make Comics.
"I guess it's impossible and I'll never break into the industry."
MAKE COMICS.
There is no better way of learning the craft of product, or proving your potential to employers, than just doing it.
You do not need anybody's permission. We don't have diplomas, nor doctorates. We can barely agree on a single standard of what a Product Manager is supposed to do.
But – there is at least one blindingly obvious industry consensus – a Product Manager makes Products.
And they don't need to be kept at the exact right temperature, given endless resource, or carefully protected in order to do this.
They find their own way.