
Case Study: Bharat Electronics Ltd
OPM: 23%
Free Float: <5%
QoQ continuous increase in ownership by institutions
ROE: ~20%
ROCE: ~28%
EV by EBITDA: 15
Leading developer of Indigenous Military Drones
Exports are prime focus for the company
D: Invested, not a recommendation
Lots of under owned stocks with robust financials within Defense Sector \U0001fa96\U0001f396\ufe0f
— Tar \u26a1 (@itsTarH) April 12, 2022
You don't even have to try looking very hard to find something interesting
More from Tar ⚡

Market always moves to the cheaper alternative, slowly at first, then all of a sudden.
As more and more companies look towards the ESG factors, IEX would be a potential beneficiary.
— Kharanshu Parikh (@Kharanshu) August 7, 2021
Source: Suven Pharma\u2019s Annual Report
\u2066@itsTarH\u2069 pic.twitter.com/sRdMIAMaVP
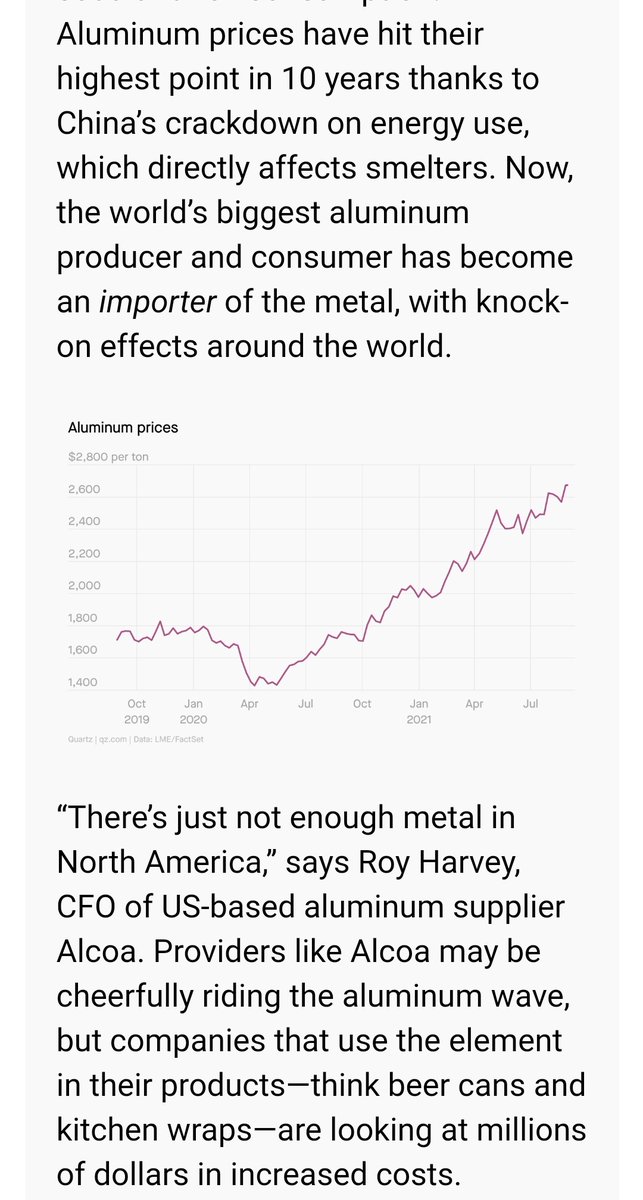
Crackdown on factories in China driven by political rulings to curb emissions
Nalco delivers the highest grossing quarter ever
2+2 = 20 https://t.co/paEk76EaGT
Common theme coming out of China is
— Tar \u26a1 (@itsTarH) August 31, 2021
1\u20e3 Govt wants to focus on general prosperity than just prosperity of a few
2\u20e3 Large focus on limiting emissions
3\u20e3 Willing to lose market share and global dominance in some categories to achieve the above
Bodes well for some sectors in India.
https://t.co/eabqmzuU2v
Aluminum prices have risen almost 40% this year on the LME. https://t.co/yWD0I1yECY pic.twitter.com/IhaJD53mmX
— Lisa Abramowicz (@lisaabramowicz1) August 31, 2021
VP Thread on
Nalco's earnings have very high sensitivity to aluminum price. In fact, it’s earnings double for every US$400/t increase in aluminum
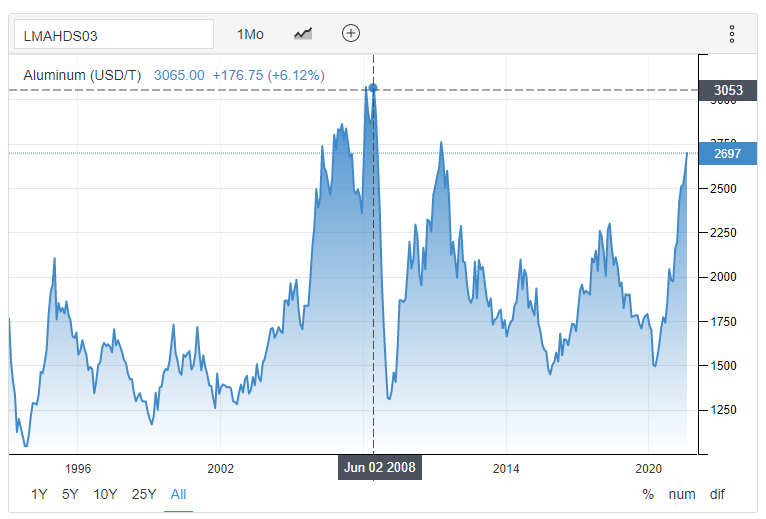
Aluminum Prices just ~14% away from their ATH of 3000+ USD/T
You May Also Like

This New York Times feature shows China with a Gini Index of less than 30, which would make it more equal than Canada, France, or the Netherlands. https://t.co/g3Sv6DZTDE
That's weird. Income inequality in China is legendary.
Let's check this number.
2/The New York Times cites the World Bank's recent report, "Fair Progress? Economic Mobility across Generations Around the World".
The report is available here:
3/The World Bank report has a graph in which it appears to show the same value for China's Gini - under 0.3.
The graph cites the World Development Indicators as its source for the income inequality data.

4/The World Development Indicators are available at the World Bank's website.
Here's the Gini index: https://t.co/MvylQzpX6A
It looks as if the latest estimate for China's Gini is 42.2.
That estimate is from 2012.
5/A Gini of 42.2 would put China in the same neighborhood as the U.S., whose Gini was estimated at 41 in 2013.
I can't find the <30 number anywhere. The only other estimate in the tables for China is from 2008, when it was estimated at 42.8.


