
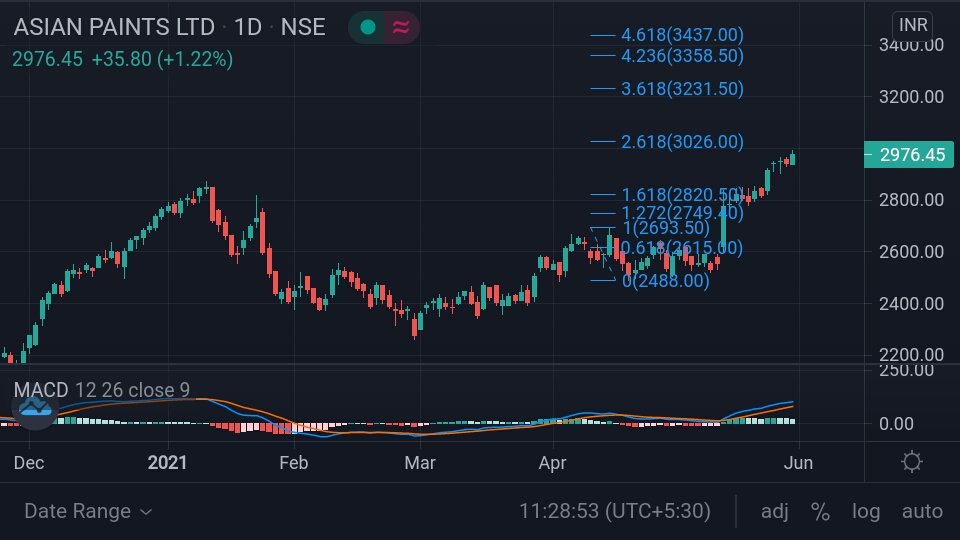
#ASIANPAINT showing RSI hidden divergence, RSI sustaining above 50 & MACD above 0, indicating overall bullish trend
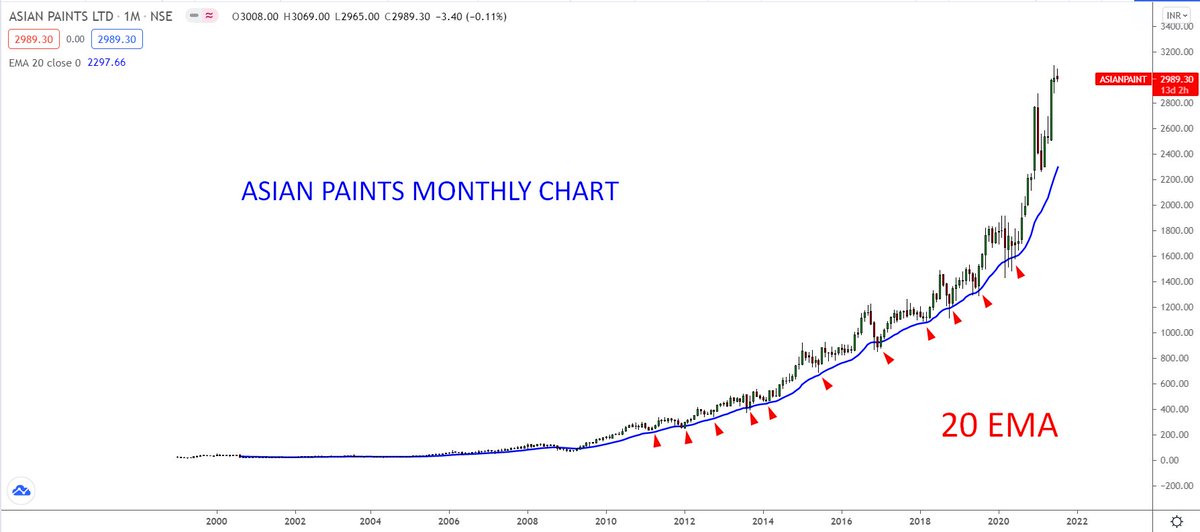
The stock took support near channel bottom. Presently at 3200. Sustaining above 3100, it can march towards 3500-4000 along the channel
#Nifty #StocksInFocus

More from Techno Prince


#LTTS
#LLTS Weekly chart shows the stock is recovering from 61.8% fibonacci pullback of last major rise
— Techno Prince (@Trader_souradep) July 24, 2022
Daily chart shows a a rounding bottom , daily RSI bullish
If it sustains above 3500 it can move towards 3900+ levels and later towards 200 DMA 4480#Nifty pic.twitter.com/6ebtfLMJZd
More from Asianpaints


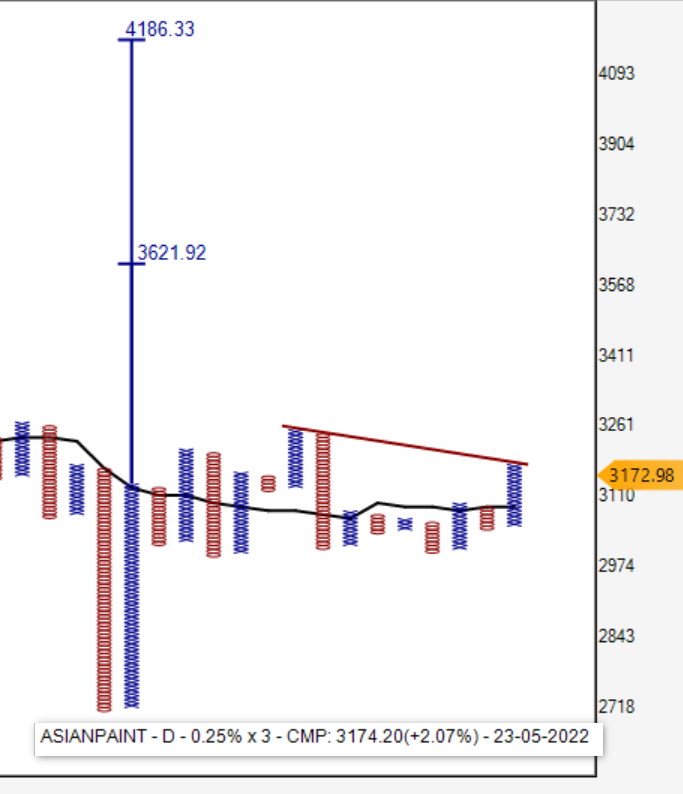
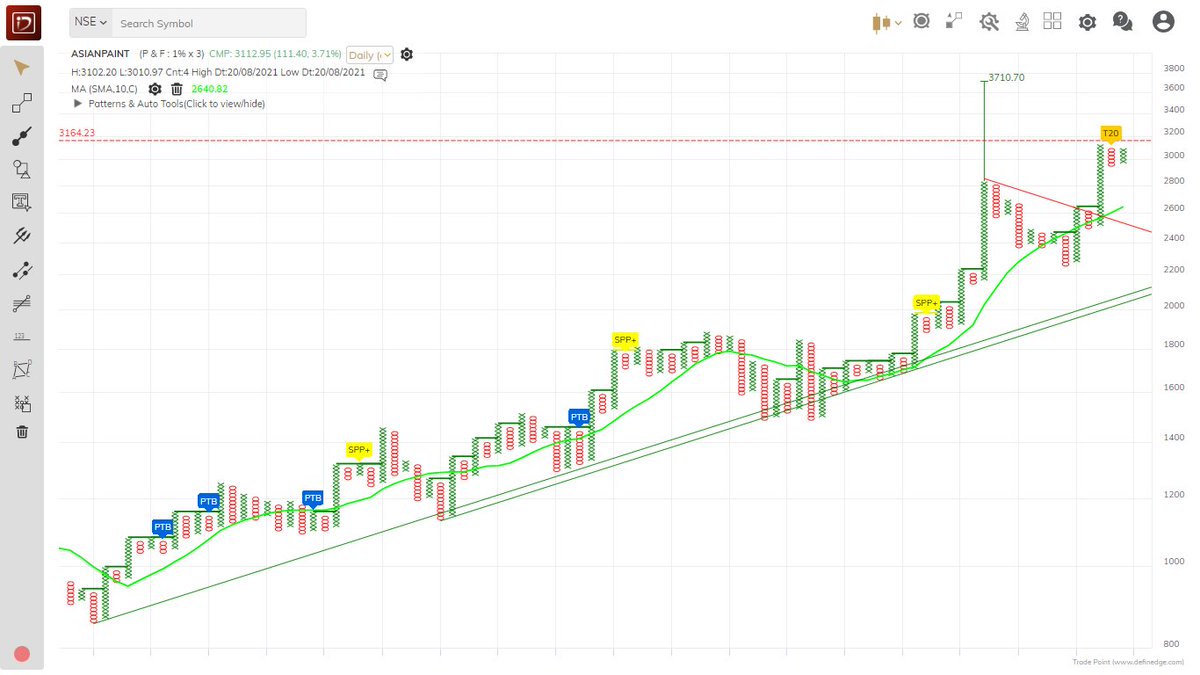
#AsianPaint Low Pole and later Double top buy above SMA after a bear trap. the earlier low pole and immediate DTB has negated the bearish anchor column. upside counts are active https://t.co/MvfHWK1IKx
#AsianPaint
— \U0001f1ee\U0001f1f3 \U0001d4d0\U0001d4f6\U0001d4f2\U0001d4fd \U0001d4e2\U0001d4ee\U0001d4fd\U0001d4f1 (@MaverickAmit01) May 23, 2022
Is it an Out of Box Idea \U0001f914 pic.twitter.com/Lg6m0AfVXB


You May Also Like


On the occasion of youtube 20k and Twitter 70k members
A small tribute/gift to members
Screeners
technical screeners - intraday and positional both
before proceeding - i have helped you , can i ask you so that it can help someone else too
thank you
positional one
run - find #stock - draw chart - find levels
1- Stocks closing daily 2% up from 5 days
https://t.co/gTZrYY3Nht
2- Weekly breakout
https://t.co/1f4ahEolYB
3- Breakouts in short term
https://t.co/BI4h0CdgO2
4- Bullish from last 5
intraday screeners
5- 15 minute Stock Breakouts
https://t.co/9eAo82iuNv
6- Intraday Buying seen in the past 15 minutes
https://t.co/XqAJKhLB5G
7- Stocks trading near day's high on 5 min chart with volume BO intraday
https://t.co/flHmm6QXmo
Thank you

