Hello traders!
Do you try to understand what is price doing? If not, let me help you.

Price can be either in a trend or range. If it is in trend, it may have either momentum or lack of momentum. If it is in range, it may have either high volatility or low volatility.

1/n

Price cannot do anything else other than these four. As a trader, our first job whenever we look at the price chart, is to try to figure out what price is doing. Is there
Trend with momentum
or
Trend with lack of momentum
or
Range with high vol
or
Range with low vol

2/n
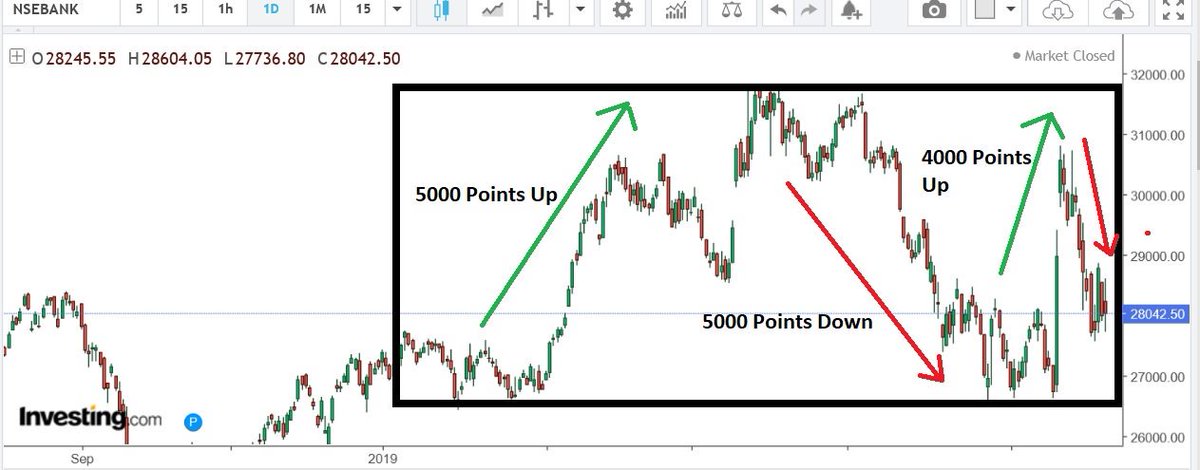
Now let me show you a daily chart of #banknifty of year 2019. First chart with big picture. It clearly shows price in a phase of "range with high volatility."

3/n
Now the same chart of #banknifty but with more understanding of all four phases of price action at different times of the year 2019.

4/n
So now after having it analyzed, we can say that currently #banknifty is in broad range of 32k to 26.5k with high volatility with CMP closer to bottom of range.

5/n
With this analysis, now we can pick any option trading strategy if we have a knowledge of options or any other trading system which allows us to benefit from range with high volatility.

End of thread.

More from All

You May Also Like

One of the most successful stock trader with special focus on cash stocks and who has a very creative mind to look out for opportunities in dark times

Covering one of the most unique set ups: Extended moves & Reversal plays

Time for a 🧵 to learn the above from @iManasArora

What qualifies for an extended move?

30-40% move in just 5-6 days is one example of extended move

How Manas used this info to book


Post that the plight of the


Example 2: Booking profits when the stock is extended from 10WMA

10WMA =


Another hack to identify extended move in a stock:

Too many green days!

Read