Understand the options chain better so that you know the correct market direction and sell the right options with a higher probability of success.
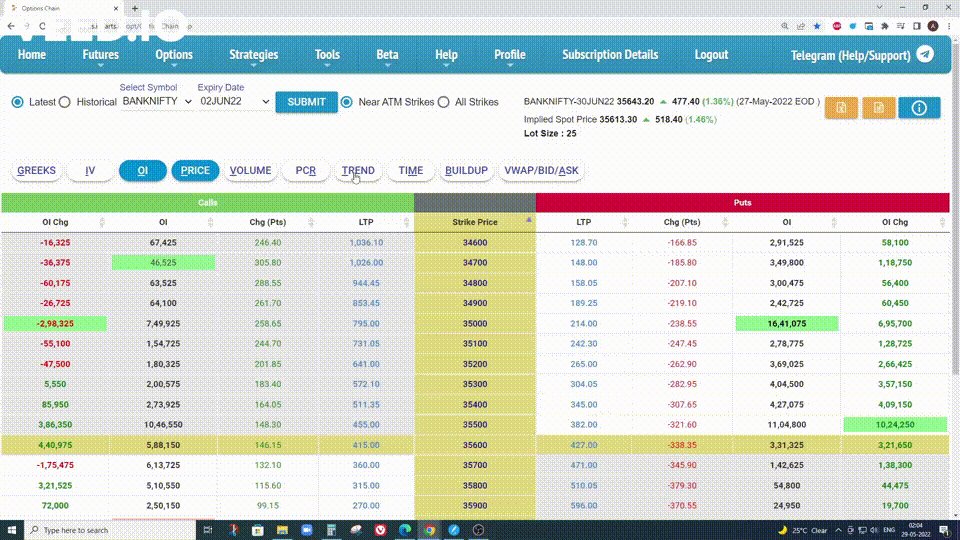
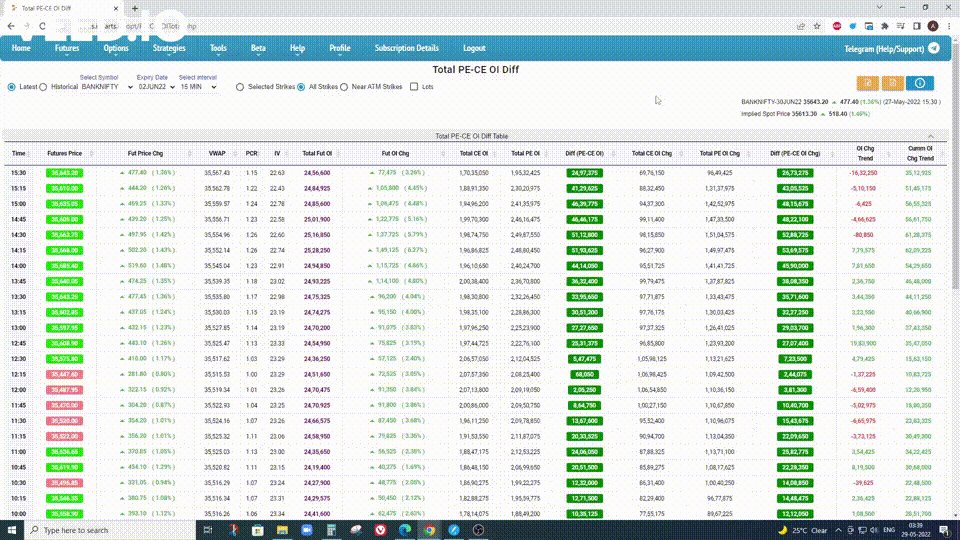
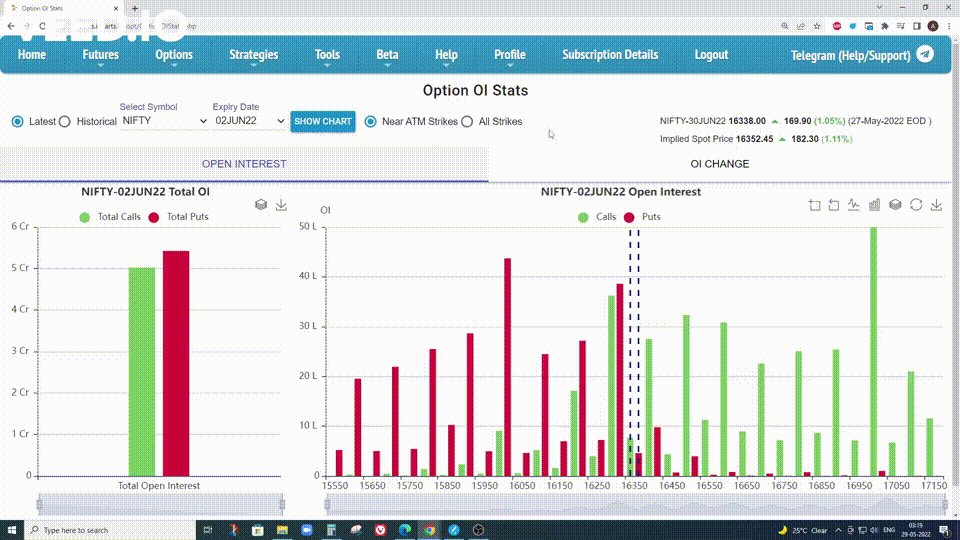
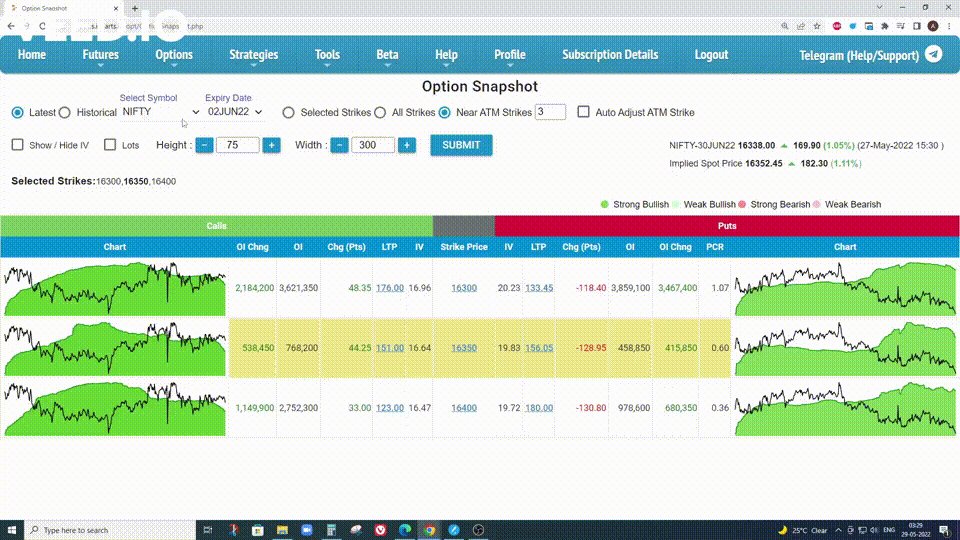
Open Option Chain on Icharts and then click on:
• Trend
• Buildup
• Vwap
Like this:


THREAD: 14 of the best resources/topics for anyone who wants to start option selling as a career. \U0001f9f5
— Aditya Todmal (@AdityaTodmal) March 13, 2022
Collaborated with @niki_poojary
@moneycontrolcom did a detailed story on my trading journey.
— Sourabh Sisodiya, CFA (@sourabhsiso19) May 26, 2020
But many couldn\u2019t read it as it needed a pro-subscription.
So here\u2019s a blog on the same :https://t.co/dwN2xieUKd#trading #journey #quant #options #algotrading #markets #OptionsTrading
Getting many DM\u2019s on how I can learn and trade like you.
— Sourabh Sisodiya, CFA (@sourabhsiso19) January 10, 2020
To be a succesful trader one needs an edge
My edge:
1)focus on selected instruments (Banknifty majorly and few stocks)
2) backtested my strategies historically (for past 10years)
(1)
Do I trade only BNF ?
— Sourabh Sisodiya, CFA (@sourabhsiso19) March 4, 2020
Other than BNF intraday , I run few other systems too.
1) Intraday Momentum
2) Positional systems
3) Vol Crush Trade etc
Goal of system trading is to run few non-correlated strategies together so that system drawdown is at the minimum.#trading #systems pic.twitter.com/mS8jFEaLUW
Options Thread
— Sourabh Sisodiya, CFA (@sourabhsiso19) December 7, 2019
How options allows to change and adjust view dynamically.
Let\u2019s understand with a live example.
Example : Nifty is at 11921 and you are bullish on Nifty.
1) Buy Naked 11900 CE(call) at 167
Breakeven : 12068
Max Loss : Rs 12555
Max Profit : Unlimited pic.twitter.com/TXMhh5HWsd
I am quite different from your style. I follow the market's volatility very closely. I have mock positions in 7-8 different strategies which allows me to stay connected. Whichever gives best profit is usually the one i trade in.
— Sarang Sood (@SarangSood) August 13, 2019
Anilji most of the time these days Theta only falls when market moves. So the Theta actually falls where market has moved to, not where our position was in the first place. By shifting we can come close to capturing the Theta fall but not always.
— Sarang Sood (@SarangSood) June 24, 2019
This week has been great so far. The main aim is to be in the right side of the volatility, rest the market will reward.
— Sarang Sood (@SarangSood) July 3, 2019
There is a difference between theta decay & fall in vega. Decay is certain but there is no guaranteed profit as delta moves can increase cost. Fall in vega on the other hand is backed by a powerful force that sells options and gives handsome returns. Our job is to identify them.
— Sarang Sood (@SarangSood) February 12, 2020
4/10
— Dr. Thomas Binder, MD (@Thomas_Binder) October 22, 2020
...indication, first of all that testing for a (single) respiratory virus is done outside of surveillance systems or need for specific therapy, but even so the lack of consideration of Ct, symptoms and clinical findings when interpreting its result. https://t.co/gHH6kwRdZG
6/10
— Dr. Thomas Binder, MD (@Thomas_Binder) October 22, 2020
The neither validated nor standardised hypersensitive RT-PCR test / Ct 35-45 for SARS-CoV-2 is abused to mislabel (also) other diseases, especially influenza, as COVID-19.https://t.co/AkFIfTCTkS
External peer review of the RTPCR test to detect SARS-CoV-2 reveals 10 major scientific flaws at the molecular and methodological level: consequences for false positive results.https://t.co/mbNY8bdw1p pic.twitter.com/OQBD4grMth
— Dr. Thomas Binder, MD (@Thomas_Binder) November 29, 2020
Thread web\u2b06\ufe0f\u2b07\ufe0f
— Dr. Thomas Binder, MD (@Thomas_Binder) December 16, 2020
The fabrication of the "asymptomatic (super) spreader" is the coronation of the total nons(ci)ense in the belief system of #CoronasWitnesses.
Asymptomatic transmission 0.7%; 95% CI 0%-4.9% - could well be 0%!https://t.co/VeZTzxXfvT
8/8
— Dr. Thomas Binder, MD (@Thomas_Binder) March 24, 2020
By the way, who the f*** created this obviously (almost) worldwide definition of #CoronaDeath?
This is not only medical malpractice, this is utterly insane!https://t.co/FFsTx4L2mw