
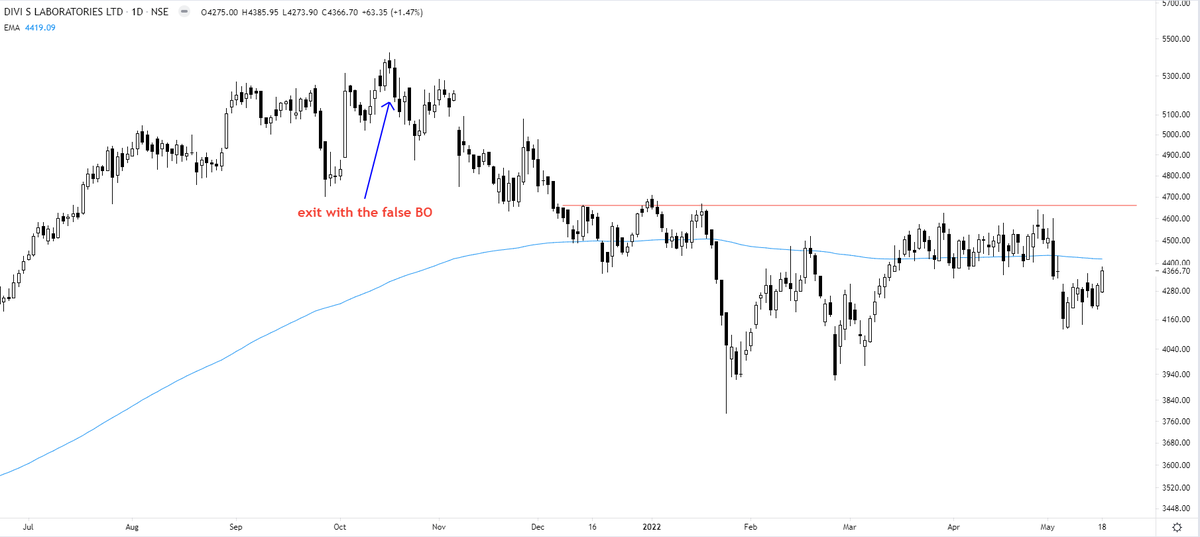
H&S busted as a chart pattern has been described by Sir Thomas Bulkowski in his work "Encyclopaedia of Chart Patterns". It happens when the price penetrates & closes above the RS. The target is the height of the Head from the neckline projected upwards from the RS.
Adani Green

More from The_Chartist 📈
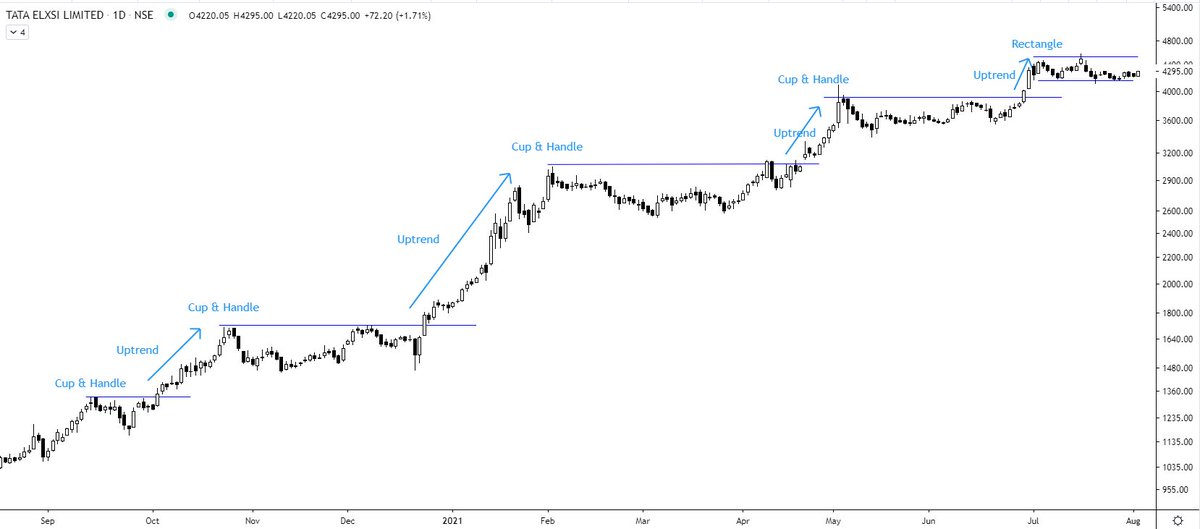
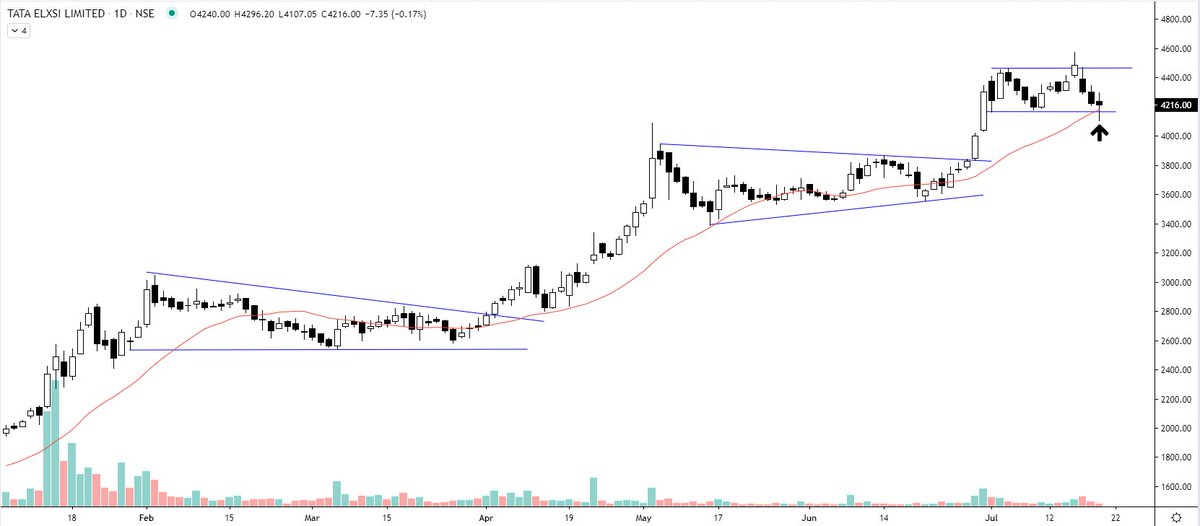
Tata Elxsi (W) - near to the resistance zone again 5th time. @nishkumar1977 @suru27 @rohanshah619 @indian_stockss @sanstocktrader @BissaGauravB @RajarshitaS @PAVLeader @Rishikesh_ADX @VijayThk @Investor_Mohit @TrendTrader85 @jitendra_stock pic.twitter.com/aIC5kO8XqA
— Steve Nison (@nison_steve) December 18, 2020
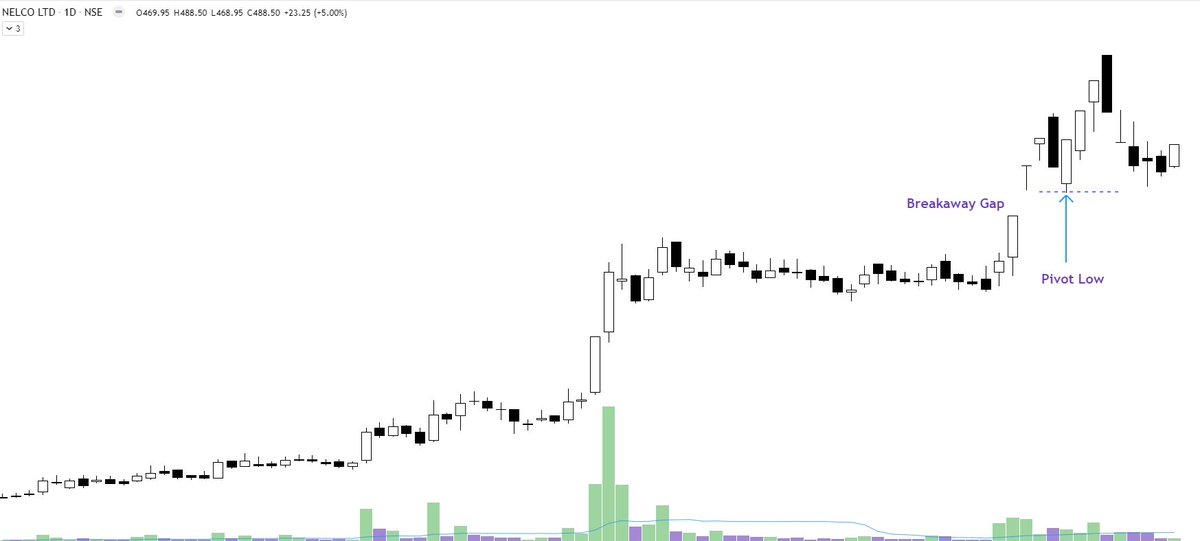
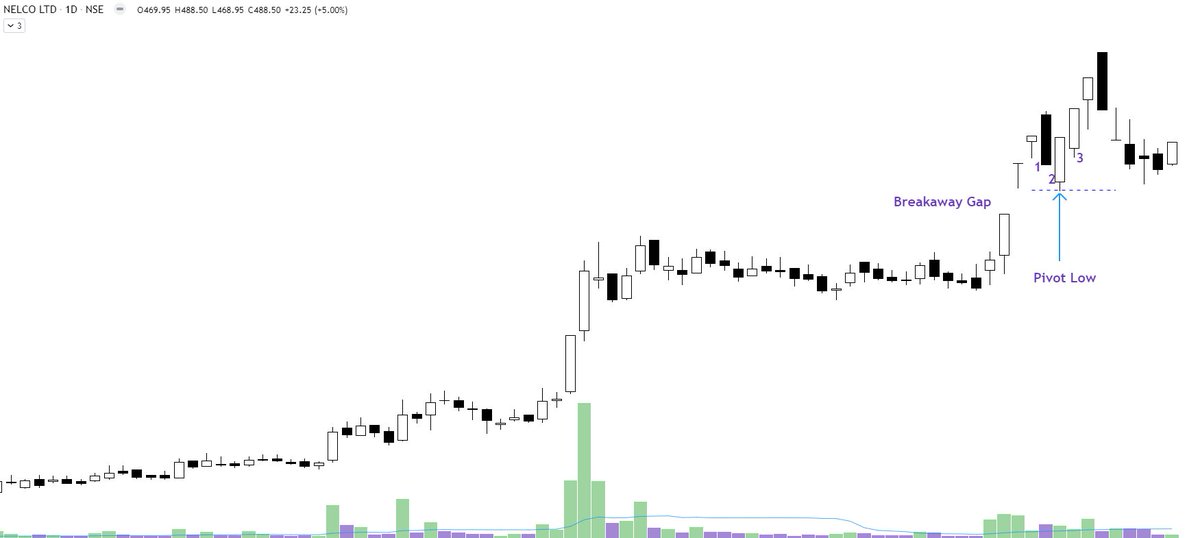

A bullish flag pattern right after the breakout. Although the broader rectangle target of 1190 is way more than this bullish flag target https://t.co/wdAzb7SS7L
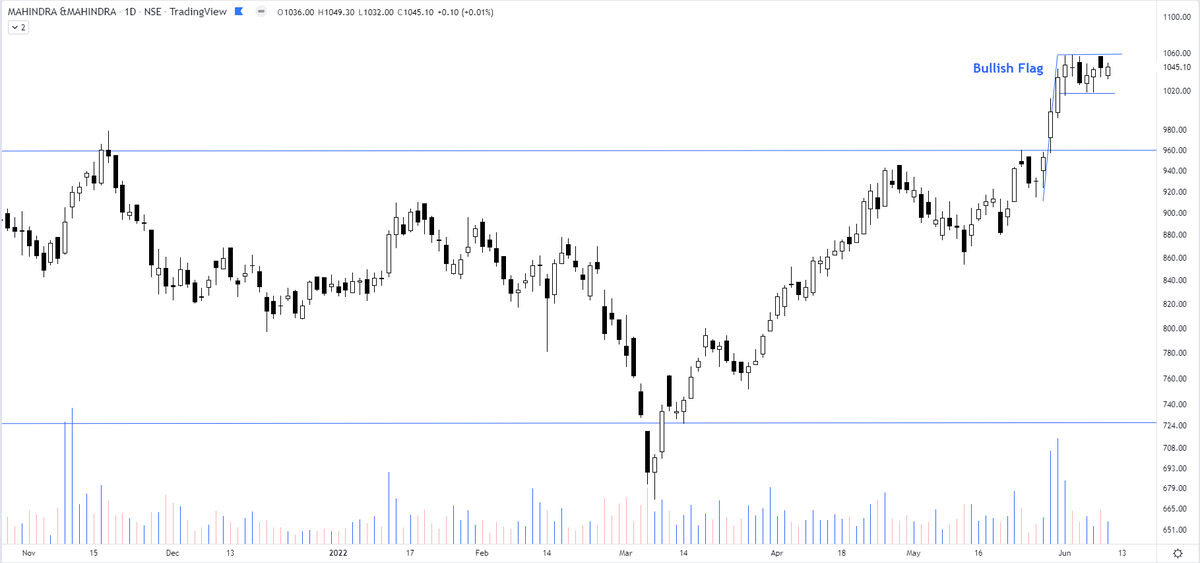
Interesting chart of Mahindra & Mahindra consolidating in a rectangle pattern & the price not falling back to the lower support. pic.twitter.com/GJ7rCfkB9f
— The_Chartist \U0001f4c8 (@charts_zone) May 26, 2022
You May Also Like


Like company moats, your personal moat should be a competitive advantage that is not only durable—it should also compound over time.
Characteristics of a personal moat below:
I'm increasingly interested in the idea of "personal moats" in the context of careers.
— Erik Torenberg (@eriktorenberg) November 22, 2018
Moats should be:
- Hard to learn and hard to do (but perhaps easier for you)
- Skills that are rare and valuable
- Legible
- Compounding over time
- Unique to your own talents & interests https://t.co/bB3k1YcH5b
2/ Like a company moat, you want to build career capital while you sleep.
As Andrew Chen noted:
People talk about \u201cpassive income\u201d a lot but not about \u201cpassive social capital\u201d or \u201cpassive networking\u201d or \u201cpassive knowledge gaining\u201d but that\u2019s what you can architect if you have a thing and it grows over time without intensive constant effort to sustain it
— Andrew Chen (@andrewchen) November 22, 2018
3/ You don’t want to build a competitive advantage that is fleeting or that will get commoditized
Things that might get commoditized over time (some longer than
Things that look like moats but likely aren\u2019t or may fade:
— Erik Torenberg (@eriktorenberg) November 22, 2018
- Proprietary networks
- Being something other than one of the best at any tournament style-game
- Many "awards"
- Twitter followers or general reach without "respect"
- Anything that depends on information asymmetry https://t.co/abjxesVIh9
4/ Before the arrival of recorded music, what used to be scarce was the actual music itself — required an in-person artist.
After recorded music, the music itself became abundant and what became scarce was curation, distribution, and self space.
5/ Similarly, in careers, what used to be (more) scarce were things like ideas, money, and exclusive relationships.
In the internet economy, what has become scarce are things like specific knowledge, rare & valuable skills, and great reputations.


