
I don't use indicators but I am sharing Dr. Alexander Elder's triple screen trading system with you. You can learn from this how-to utilize multiple time frames to further time your purchases.
Two others are:
Martin Prings' KST System
Robert Krausz's Multiple Timeframes
More from The_Chartist 📈
H&S tops with ascending/descending necklines https://t.co/cmRRHp5rlh
Sir Edwards & Magee discussed sloping necklines in H&S in their classical work. I am considering this breakdown by Affle as an H&S top breakdown with a target open of 770.
— The_Chartist \U0001f4c8 (@charts_zone) May 25, 2022
The target also coincides with support at the exact same level. pic.twitter.com/n84kSgkg4q

More from Screeners


And here it is:
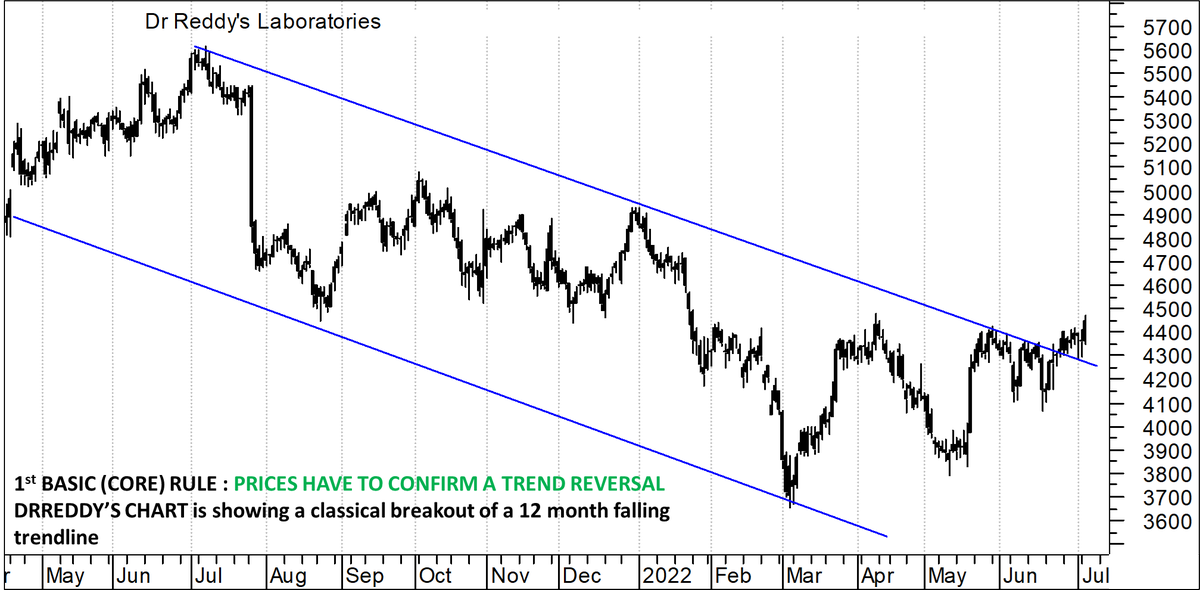
The 3 most important rules which I follow in spotting a major trend reversal laid out in this stock, 'as it is'.
1. Trend reversal
2. Price patterns
3. Indicator confirmation
Perfect TA chart.
All boxes ticked !!
Do comment, like and share !!!
#DRREDDY https://t.co/4JGg71GenE
The 3 most important rules which I follow in spotting a major trend reversal laid out in this stock, 'as it is'.
1. Trend reversal
2. Price patterns
3. Indicator confirmation
Perfect TA chart.
All boxes ticked !!
Do comment, like and share !!!
#DRREDDY https://t.co/4JGg71GenE
Today at 2 pm:
— Kunal Bothra (@kbbothra) July 5, 2022
I will bring to you one of the SUPER FINEST TECHNICAL CHART setup on a largecap name.
Agar yeh nahi chal paya toh kuch nahi chal paayega\u2026
Retweeet tsunami has to come for this one\u2026 #stock #breakout #technical
You May Also Like

Oh my Goodness!!!
I might have a panic attack due to excitement!!
Read this thread to the end...I just had an epiphany and my mind is blown. Actually, more than blown. More like OBLITERATED! This is the thing! This is the thing that will blow the entire thing out of the water!
Has this man been concealing his true identity?
Is this man a supposed 'dead' Seal Team Six soldier?
Witness protection to be kept safe until the right moment when all will be revealed?!
Who ELSE is alive that may have faked their death/gone into witness protection?

Were "golden tickets" inside the envelopes??

Are these "golden tickets" going to lead to their ultimate undoing?
Review crumbs on the board re: 'gold'.

#SEALTeam6 Trump re-tweeted this.

I might have a panic attack due to excitement!!
Read this thread to the end...I just had an epiphany and my mind is blown. Actually, more than blown. More like OBLITERATED! This is the thing! This is the thing that will blow the entire thing out of the water!
Tik Tok pic.twitter.com/8X3oMxvncP
— Scotty Mar10 (@Allenma15086871) December 29, 2020
Has this man been concealing his true identity?
Is this man a supposed 'dead' Seal Team Six soldier?
Witness protection to be kept safe until the right moment when all will be revealed?!
Who ELSE is alive that may have faked their death/gone into witness protection?
Were "golden tickets" inside the envelopes??
Are these "golden tickets" going to lead to their ultimate undoing?
Review crumbs on the board re: 'gold'.
#SEALTeam6 Trump re-tweeted this.


A brief analysis and comparison of the CSS for Twitter's PWA vs Twitter's legacy desktop website. The difference is dramatic and I'll touch on some reasons why.
Legacy site *downloads* ~630 KB CSS per theme and writing direction.
6,769 rules
9,252 selectors
16.7k declarations
3,370 unique declarations
44 media queries
36 unique colors
50 unique background colors
46 unique font sizes
39 unique z-indices
https://t.co/qyl4Bt1i5x

PWA *incrementally generates* ~30 KB CSS that handles all themes and writing directions.
735 rules
740 selectors
757 declarations
730 unique declarations
0 media queries
11 unique colors
32 unique background colors
15 unique font sizes
7 unique z-indices
https://t.co/w7oNG5KUkJ

The legacy site's CSS is what happens when hundreds of people directly write CSS over many years. Specificity wars, redundancy, a house of cards that can't be fixed. The result is extremely inefficient and error-prone styling that punishes users and developers.
The PWA's CSS is generated on-demand by a JS framework that manages styles and outputs "atomic CSS". The framework can enforce strict constraints and perform optimisations, which is why the CSS is so much smaller and safer. Style conflicts and unbounded CSS growth are avoided.
Legacy site *downloads* ~630 KB CSS per theme and writing direction.
6,769 rules
9,252 selectors
16.7k declarations
3,370 unique declarations
44 media queries
36 unique colors
50 unique background colors
46 unique font sizes
39 unique z-indices
https://t.co/qyl4Bt1i5x
PWA *incrementally generates* ~30 KB CSS that handles all themes and writing directions.
735 rules
740 selectors
757 declarations
730 unique declarations
0 media queries
11 unique colors
32 unique background colors
15 unique font sizes
7 unique z-indices
https://t.co/w7oNG5KUkJ
The legacy site's CSS is what happens when hundreds of people directly write CSS over many years. Specificity wars, redundancy, a house of cards that can't be fixed. The result is extremely inefficient and error-prone styling that punishes users and developers.
The PWA's CSS is generated on-demand by a JS framework that manages styles and outputs "atomic CSS". The framework can enforce strict constraints and perform optimisations, which is why the CSS is so much smaller and safer. Style conflicts and unbounded CSS growth are avoided.