🐳 Watchlists + @unusual_whales 🐳

Unusual Whales is an incredible tool that can take anyone's trading to the next level. It presents a ton of data, which can often be hard to synthesize.

This thread will provide a simplistic approach to analyzing and utilizing flow data. 🌊

1. Where To Start

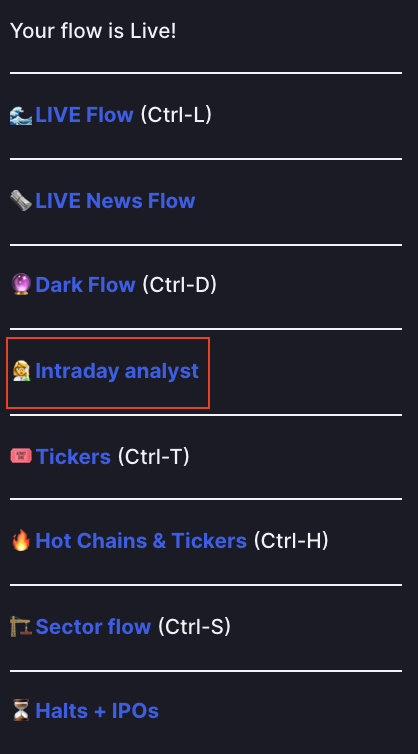
Start with the "Hot Chains & Tickers" page. Not only does this display the tickers with the most option volume, but it also shows the most active chains. Better yet, you can filter by sector and market cap.

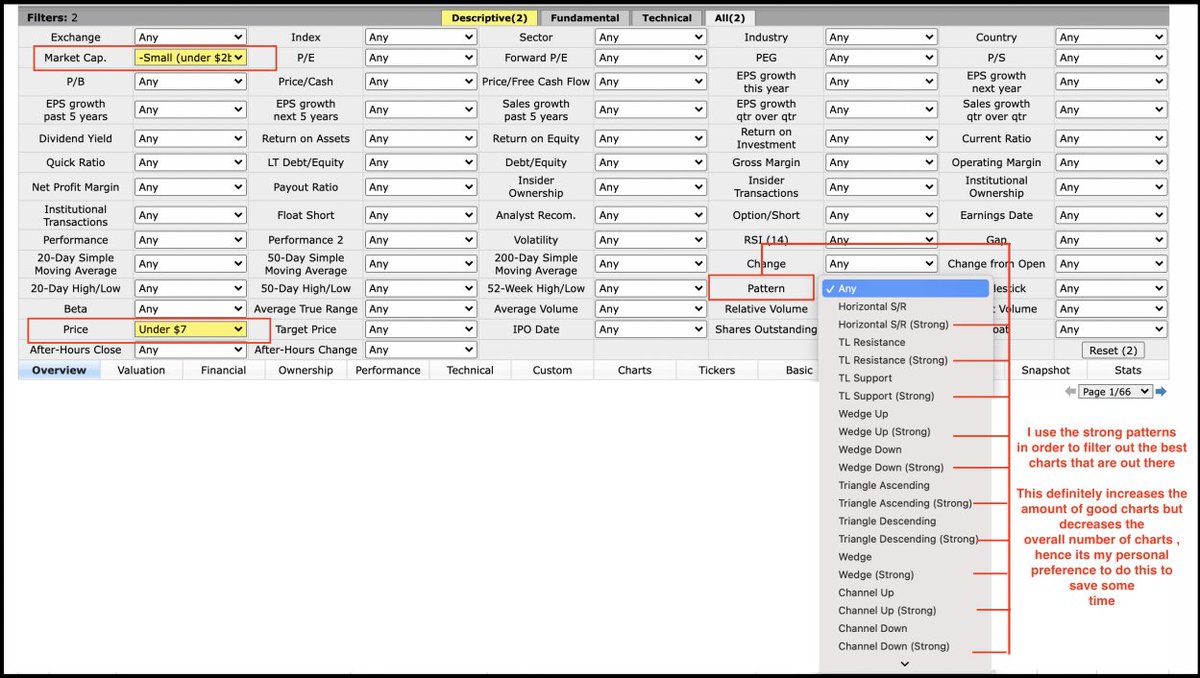
Below are some specific filter examples:
2. Analysis

The "Intraday Analyst" page is your best friend here. The first thing I do is scroll down to the "Most Active Chains" table.

I'm looking for short-term exp. OTM contracts with heavy volume that look "unusual."

Examples are included below:
$LCID - Closed Wed. 11/3 ~$36.50. 40c weeklies required a 10% move in 2 days to go ITM. $LCID closed at $41.80 on Friday.

$AMD - Closed Tues. 11/2 ~$127.60. 130c got hit hard. Closed the week over $136.

$NVDA - Closed Thurs. 10/28 ~249.40, 250c 🔨. Closed Friday ~255.70.
Weekly OTM strikes with heavy volume can lead to huge moves. Now what makes these so unusual?

- OTM with little time to exp. = urgency
- Heavy volume on a certain strike can mean volatility in that area = good for options
- Vol. much greater OTM than ATM = big move possibility
Now it is crucial to note that volume includes both buying and selling. Suppose much of the action on a chain is selling volume. This would be bearish. However, in short-term options trading, you need volatility. Volume is what you want.

Read: https://t.co/jaWI8lo1tX
Staying on the "Intraday Analyst" page:

This is right above the previous table. What strikes are being targeted for 11/12 exp. on $LCID? I can see that 40c had heavy action. Friday 11/5 closed at almost $42 so that makes sense.

But the 45c volume and OI grabs my attention.
I can confirm this by checking the most active chains. The highest volume OTM option on Fri. 11/5 for 11/12 exp. was in fact the 11/12 45c.

Going into Monday 11/8, I can logically have $LCID 45c on my watchlist without even looking at the chart yet.
3. Targeted Flow Fliters

If I'm looking to play weeklies, I'll simply filter to only weekly expiry. Then I'll toggle the minimum premium in the "Premium Range" based on the stock. I'll focus mainly on the "🐂 V 🐻 Prems" chart.

Min. premium examples in order: 100k, 150k, 200k.
In each of these three situations, bullish premiums are over 60%, which is a bullish sign. Being concerned with the short-term move (weekly), this process has been the most simple and understandable when it comes to recent large orders.
4. Conclusion

No tool is a crystal ball. Unusual Whales gives you the opportunity to view, analyze, and customize more data than you could ever ask for. It will take a day or two to figure everything out, but it can be very rewarding.
Unusual Whales is a game-changer when it comes to catching big moves BEFORE they happen.

These tools empower retail traders by enabling us to follow the flow. 🌊

To subscribe (and support me), click the link below! Or use code: adamslivertrade

🐳🌊🐳🌊
https://t.co/rqAUOJPROA

More from Tradingthread

THREAD // How I Invest

1. Successful Investing starts with Education
2. Psychology of Trading & General Rules
3. Essentials of Fundamental Analysis
4. Master Technical Analysis
5. Screening for Stocks
6. Making a Watchlist
7. Money Management
8. Diversification of Accounts

1 // Successful Investing starts with Education

Following 2000-2002, I realized that I needed an education to help me understand many of the topics mentioned in this thread.

So, I started to educated myself using books. Seek mentors as well.

Then


2 // Psychology of Trading & General Rules

Develop a working SYSTEM (for you)
Preservation of capital
Consistent profitability
Cutting losses short
Superior returns

Understanding “You”:
What is your general personality?
What influences your decisions?
What is your lifestyle?

3a // Essentials of Fundamental Analysis

Earnings Per Share:
1. % Change in Latest Qtr EPS vs. Same QTR Prior Year
2. % Increase in Next Year’s EPS Estimate vs Prior Year’s Actual EPS
3. % Change in Latest EPS, trend past several qtrs
4. Annual % EPS Growth Rate of Last 3 Years

3b // Essentials of Fundamental Analysis

Sales / Revenues
1. % Change Latest Qtr’s Sales vs. Same Qtr Prior Year
2. % Change Latest Reported Fiscal Year Sales vs. Prior Year
3. % Change in Latest Sales, trend past several qtrs
4. Annual % Sales Growth Rate of Last 3 Years
A mega thread, this contains some of my popular threads which may help you in your trading.

Thanks for reading :)


Pyramiding


Don't change your trading


Trendlines


Scaling in-out

You May Also Like

Master Thread of all my threads!

Hello!! 👋

• I have curated some of the best tweets from the best traders we know of.

• Making one master thread and will keep posting all my threads under this.

• Go through this for super learning/value totally free of cost! 😃

1. 7 FREE OPTION TRADING COURSES FOR


2. THE ABSOLUTE BEST 15 SCANNERS EXPERTS ARE USING

Got these scanners from the following accounts:

1. @Pathik_Trader
2. @sanjufunda
3. @sanstocktrader
4. @SouravSenguptaI
5. @Rishikesh_ADX


3. 12 TRADING SETUPS which experts are using.

These setups I found from the following 4 accounts:

1. @Pathik_Trader
2. @sourabhsiso19
3. @ITRADE191
4.


4. Curated tweets on HOW TO SELL STRADDLES.

Everything covered in this thread.
1. Management
2. How to initiate
3. When to exit straddles
4. Examples
5. Videos on