
This used to be easy to answer. @gordonjohnson19 was famous for his bearish price target on $TSLA: $ 87. Prior to the 5/1 split. /3
A thread on $TSLA / $TSLAQ the stock in 2020:
Don’t retweet this, @gordonjohnson19 would not like the unit of #Gordon to trend. /2
This used to be easy to answer. @gordonjohnson19 was famous for his bearish price target on $TSLA: $ 87. Prior to the 5/1 split. /3

🍾
More from Trading




You May Also Like










1/x Fort Detrick History
Mr. Patrick, one of the chief scientists at the Army Biological Warfare Laboratories at Fort Detrick in Frederick, Md., held five classified US patents for the process of weaponizing anthrax.
2/x
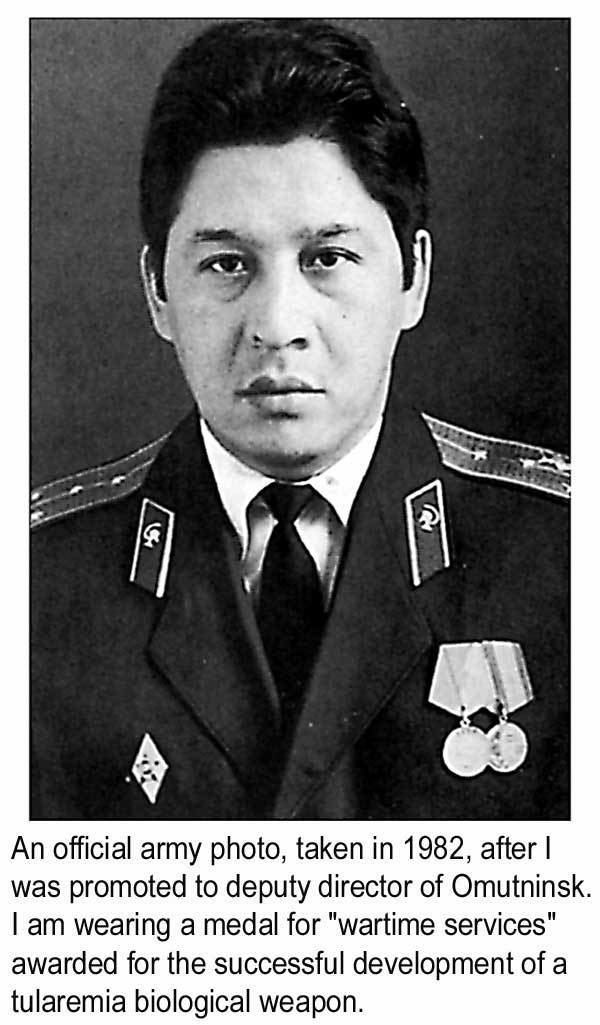
Under Mr. Patrick’s direction, scientists at Fort Detrick developed a tularemia agent that, if disseminated by airplane, could cause casualties & sickness over 1000s mi². In a 10,000 mi² range, it had 90% casualty rate & 50% fatality rate
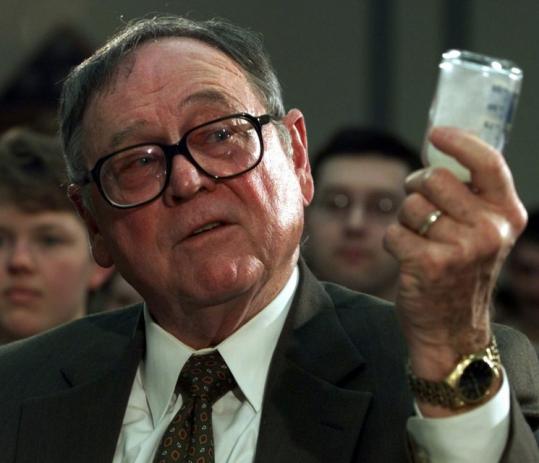
3/x His team explored Q fever, plague, & Venezuelan equine encephalitis, testing more than 20 anthrax strains to discern most lethal variety. Fort Detrick scientists used aerosol spray systems inside fountain pens, walking sticks, light bulbs, & even in 1953 Mercury exhaust pipes
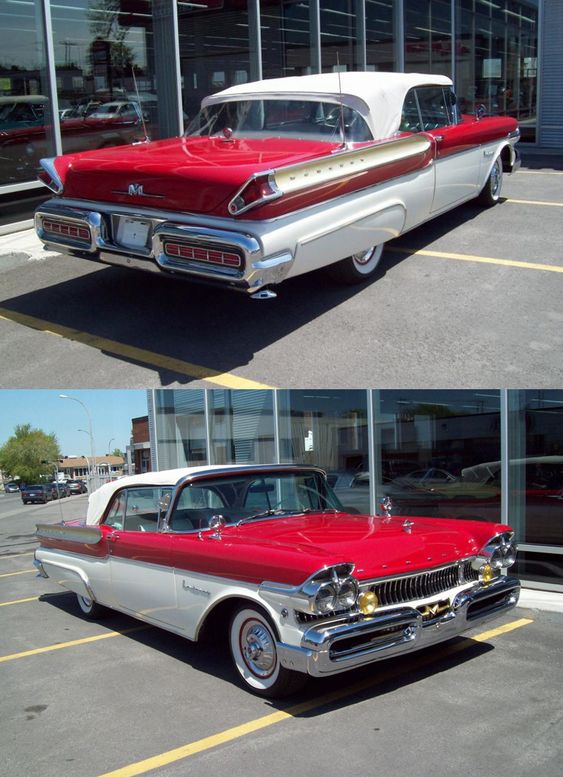
4/x After retiring in 1986, Mr. Patrick remained one of the world’s foremost specialists on biological warfare & was a consultant to the CIA, FBI, & US military. He debriefed Soviet defector Ken Alibek, the deputy chief of the Soviet biowarfare program
https://t.co/sHqSaTSqtB
5/x Back in Time
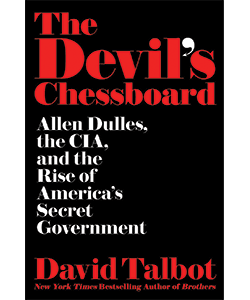
In 1949 the Army created a small team of chemists at "Camp Detrick" called Special Operations Division. Its assignment was to find military uses for toxic bacteria. The coercive use of toxins was a new field, which fascinated Allen Dulles, later head of the CIA
Mr. Patrick, one of the chief scientists at the Army Biological Warfare Laboratories at Fort Detrick in Frederick, Md., held five classified US patents for the process of weaponizing anthrax.
2/x
Under Mr. Patrick’s direction, scientists at Fort Detrick developed a tularemia agent that, if disseminated by airplane, could cause casualties & sickness over 1000s mi². In a 10,000 mi² range, it had 90% casualty rate & 50% fatality rate
3/x His team explored Q fever, plague, & Venezuelan equine encephalitis, testing more than 20 anthrax strains to discern most lethal variety. Fort Detrick scientists used aerosol spray systems inside fountain pens, walking sticks, light bulbs, & even in 1953 Mercury exhaust pipes
4/x After retiring in 1986, Mr. Patrick remained one of the world’s foremost specialists on biological warfare & was a consultant to the CIA, FBI, & US military. He debriefed Soviet defector Ken Alibek, the deputy chief of the Soviet biowarfare program
https://t.co/sHqSaTSqtB
5/x Back in Time
In 1949 the Army created a small team of chemists at "Camp Detrick" called Special Operations Division. Its assignment was to find military uses for toxic bacteria. The coercive use of toxins was a new field, which fascinated Allen Dulles, later head of the CIA