If you tell me the 15-minute chart shows a bearish divergence, I'll probably tell you I don't give a shit. This thread will teach you why.

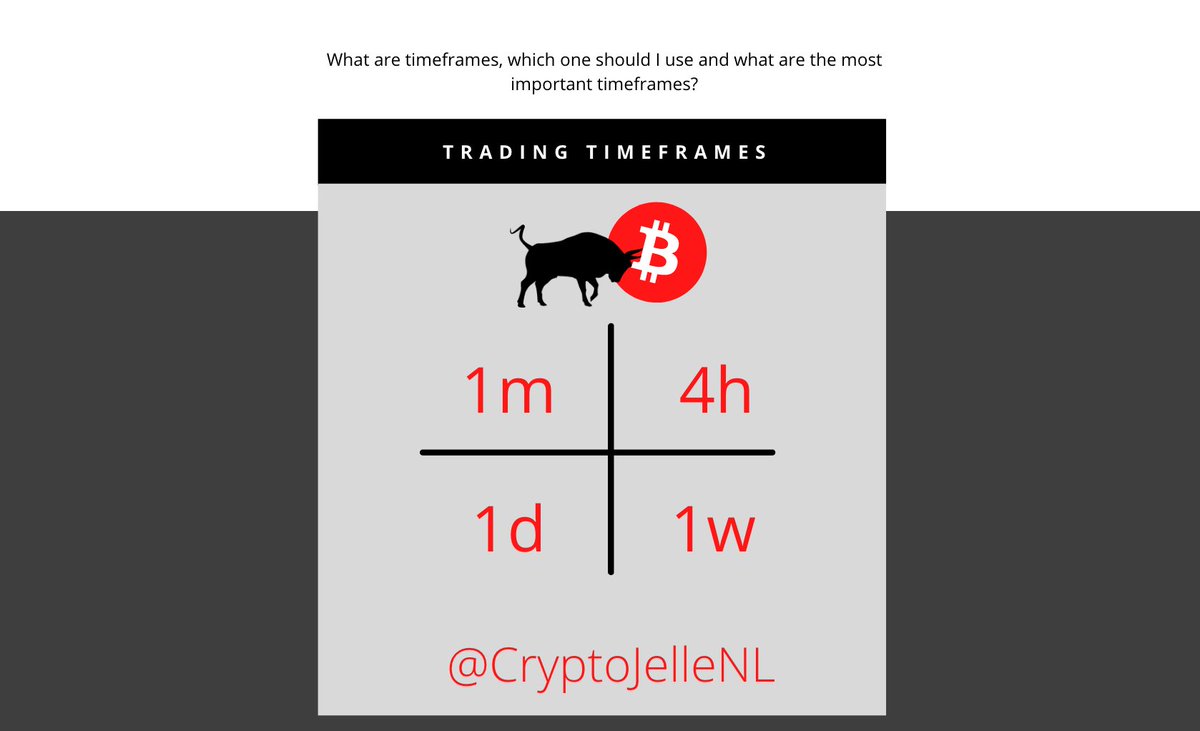
Understanding timeframes is crucial in trading and technical analysis.

I'll teach you what they are, how they work and their use.
Usual disclaimer, this thread is simply my personal understanding of timeframes and their use, not a globally agreed-upon thing.

This information does not constitute financial advice. You know the drill. Let's get into it.
Some abbreviations

LTF = Lower timeframe
HTF = Higher timeframe
S/R = Support & Resistance
PA = Price Action
Timeframes refer to how much time a single candlestick represents on a chart. There are timeframes all the way from a single second to multiple years.
The 1-hour timeframe consists of 4 15-minute candles, or 60 1-minute candles.

This is why if you're trading the 4h chart, you don't care much about a 1-minute bearish divergence. The movements on much lower timeframes take place much faster than on higher timeframes.
This means the bearish divergence on the 1 minute might play out, reverse and completely be dalai-lamad before the 4h candle even closes.
This is also why I personally prefer to wait for candle closes to trade. LTF PA above a HTF level is just a fakeout if the HTF candle closes below the level.

Closes constitute confirmation.
This means that a weekly level can see price violate the level quite uncomfortably deep during the week, as long as it closes above.

This is why many traders get shaken out at HTF levels, as happened in September 2020.
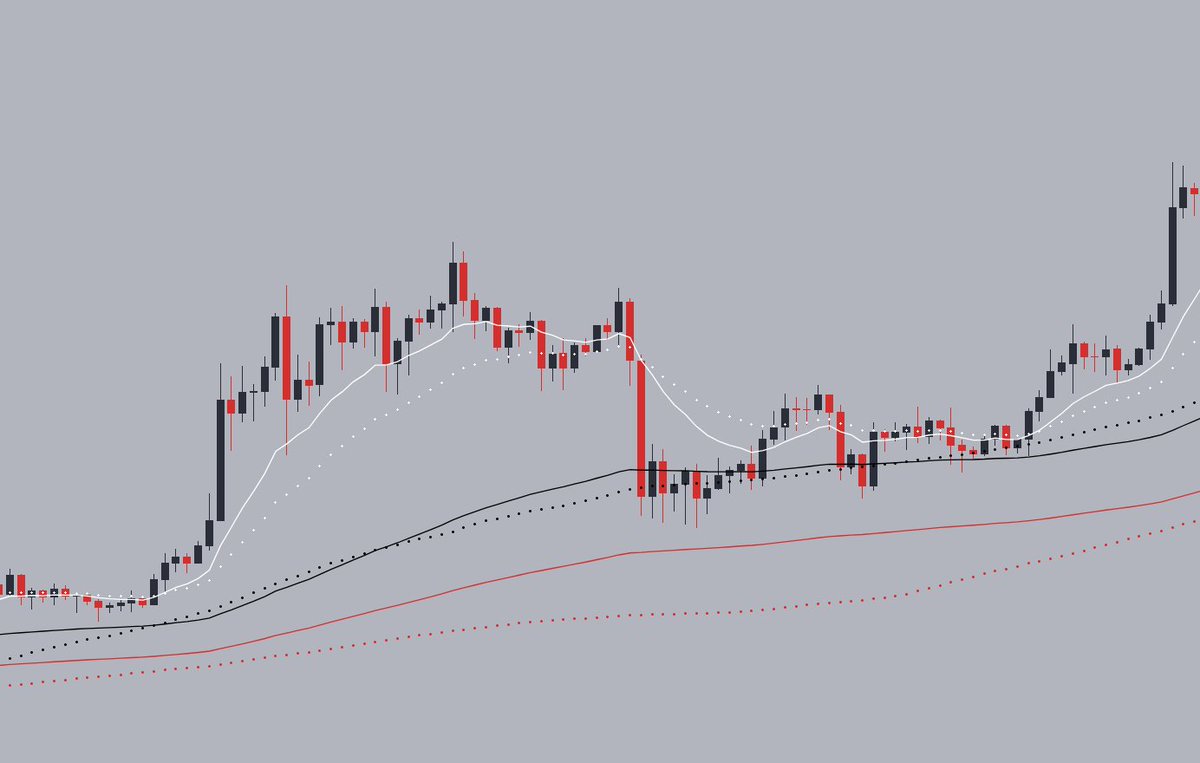
Conclusion: if you trade high timeframes, you better bring your steel hands and diamond balls.
So, which timeframe is more important? This naturally depends on your trading style, but in any case, the higher timeframes are considered to be the stronger ones.
In other words, HTF S/R levels are generally respected across all timeframes, whereas a LTF level will likely be completely ignored on the higher timeframes.

Regardless of your style, I recommend mapping out the HTF levels. Start with monthly, then weekly and daily levels.
These will be the most important levels that many will have marked out. There will be low-timeframe volatility around the HTF levels, which often allows for great scalps.
I also recommend monitoring lower-timeframe PA around your level to get an idea of what the close will be like. For example, if the 1h chart looks like a dog's dinner a few hours before daily close, it will probably affect the daily candle.
You have to find which timeframe works for you. If you are generally impatient, lower timeframes will work better for you. If you're patient and risk-averse, trade the higher timeframes.

Or, if you're truly a chad, trade HTF and also scalp around the levels.
Most important of all, do NOT let ugly looking lower timeframes shake you out of high timeframe positions. This happens all the time, don't be that guy.
Long story short:

- Map out HTF levels
- Watch LTF PA around HTF levels
- Find a timeframe that works for you.
- Don't let lower timeframes affect your high timeframe thesis.
I hope this helps. If you have any questions, do not hesitate to ask.

If you need an exchange, join me on FTX. I got you a 5% discount on fees :)

https://t.co/Sll9nkNsRd

More from Trading

TradingView isn't just charts

It's much more powerful than you think

9 things TradingView can do, you'll wish you knew yesterday: 🧵

Collaborated with @niki_poojary

1/ Free Multi Timeframe Analysis

Step 1. Download Vivaldi Browser

Step 2. Login to trading view

Step 3. Open bank nifty chart in 4 separate windows

Step 4. Click on the first tab and shift + click by mouse on the last tab.

Step 5. Select "Tile all 4 tabs"


What happens is you get 4 charts joint on one screen.

Refer to the attached picture.

The best part about this is this is absolutely free to do.

Also, do note:

I do not have the paid version of trading view.


2/ Free Multiple Watchlists

Go through this informative thread where @sarosijghosh teaches you how to create multiple free watchlists in the free


3/ Free Segregation into different headers/sectors

You can create multiple sections sector-wise for free.

1. Long tap on any index/stock and click on "Add section above."
2. Secgregate the stocks/indices based on where they belong.

Kinda like how I did in the picture below.

You May Also Like

The YouTube algorithm that I helped build in 2011 still recommends the flat earth theory by the *hundreds of millions*. This investigation by @RawStory shows some of the real-life consequences of this badly designed AI.


This spring at SxSW, @SusanWojcicki promised "Wikipedia snippets" on debated videos. But they didn't put them on flat earth videos, and instead @YouTube is promoting merchandising such as "NASA lies - Never Trust a Snake". 2/


A few example of flat earth videos that were promoted by YouTube #today:
https://t.co/TumQiX2tlj 3/

https://t.co/uAORIJ5BYX 4/

https://t.co/yOGZ0pLfHG 5/
THREAD: 12 Things Everyone Should Know About IQ

1. IQ is one of the most heritable psychological traits – that is, individual differences in IQ are strongly associated with individual differences in genes (at least in fairly typical modern environments). https://t.co/3XxzW9bxLE


2. The heritability of IQ *increases* from childhood to adulthood. Meanwhile, the effect of the shared environment largely fades away. In other words, when it comes to IQ, nature becomes more important as we get older, nurture less.
https://t.co/UqtS1lpw3n


3. IQ scores have been increasing for the last century or so, a phenomenon known as the Flynn effect. https://t.co/sCZvCst3hw (N ≈ 4 million)

(Note that the Flynn effect shows that IQ isn't 100% genetic; it doesn't show that it's 100% environmental.)


4. IQ predicts many important real world outcomes.

For example, though far from perfect, IQ is the single-best predictor of job performance we have – much better than Emotional Intelligence, the Big Five, Grit, etc. https://t.co/rKUgKDAAVx https://t.co/DWbVI8QSU3


5. Higher IQ is associated with a lower risk of death from most causes, including cardiovascular disease, respiratory disease, most forms of cancer, homicide, suicide, and accident. https://t.co/PJjGNyeQRA (N = 728,160)