
1/x Vanna is back & ready to turn back on the charm! Overnight the market hit our weeklong target of **3705 and pulled back... We were able to take profits & play for a bit of morning digestion. It’s been a nice +3.5% in a week w/a few extra scalps along the way...But the best

More from Cem Karsan 🥐
1/x As we’ve been calling for since Nov, today we finally got our 2 ‘Georgia Peaches’🍑 precisely on schedule, as we’ve called for since Aug, & the underlying rotation has confirmed now for months, this matters. This is a historic turning point. It matters not only https://t.co/BFxKGrI1Oo

2/x for this year, but for the economic trajectory of America & likely the macroeconomic regime of the developed world for the coming decade. That said, contrary to popular belief, the market does not move based on news in the short term if the positioning doesn’t allow it to.
3/x & our old friend Gary the 🦍 & his sidekick Vanna are positioned to have this market pinned through 1/11. So, as explained ad nauseam, the election news, though fundamentally important, won’t matter to the index itself in the ST. As predicted, the largest moves from the GA
4/x runoff INITIALLY have come from factor rotation. This should continue to be the case, as the street is oversupplied IVol & the index is pinned. This not only allows for idiosyncratic risk moves in constituents, but it actually FORCES extreme noncorrelation & rotation, as we
5/x have witnessed now for the past 2 days. This Vol compression will be increasingly difficult to break free from until 1/11-1/15, but the window of weakness is coming...soon the final hedges from the ‘election hump’ in Nov will expire with the Jan monthly options. Once the
1/x Well you can\u2019t say I didn\u2019t warn you... We\u2019ve been eying that 3770.5 level and the 1/5-1/13 window for many weeks. To get it a day early, @ the lowest edge of the upper range, tells me that there\u2019s understandable concern over the impending outcome of the runoff. As I\u2019ve said https://t.co/BxG2DzdXqt pic.twitter.com/ki4sYprwIH
— Cem Karsan \U0001f950 (@jam_croissant) January 5, 2021
2/x for this year, but for the economic trajectory of America & likely the macroeconomic regime of the developed world for the coming decade. That said, contrary to popular belief, the market does not move based on news in the short term if the positioning doesn’t allow it to.
3/x & our old friend Gary the 🦍 & his sidekick Vanna are positioned to have this market pinned through 1/11. So, as explained ad nauseam, the election news, though fundamentally important, won’t matter to the index itself in the ST. As predicted, the largest moves from the GA
4/x runoff INITIALLY have come from factor rotation. This should continue to be the case, as the street is oversupplied IVol & the index is pinned. This not only allows for idiosyncratic risk moves in constituents, but it actually FORCES extreme noncorrelation & rotation, as we
5/x have witnessed now for the past 2 days. This Vol compression will be increasingly difficult to break free from until 1/11-1/15, but the window of weakness is coming...soon the final hedges from the ‘election hump’ in Nov will expire with the Jan monthly options. Once the



More from Trading







𝗡𝗶𝗳𝘁𝘆-𝗕𝗮𝗻𝗸𝗻𝗶𝗳𝘁𝘆 𝗢𝗽𝘁𝗶𝗼𝗻 𝗕𝘂𝘆𝗶𝗻𝗴 𝗦𝘁𝗿𝗮𝘁𝗲𝗴𝘆
Complete Backtest and Indicator link
🧵 A Thread 🧵
𝗦𝗲𝘁𝘂𝗽:
🔸 Monthly Option Buying
🔸 50 ema on 3 min timeframe
🔸 Supertrend 10 , 3
🔸 Chart : Banknifty , Nifty Futures as we backtested on futures
🔸 Entry 9:20 to 3:00
🔸 Max 3 Entries per day
🔸 Premium nearest to 200 Rs only
[2/18]
Why Monthly Option buying ?
🔸 Less theta decay compared to weekly options
🔸 Less Volatility
🔸 Supertrend and MA Settings
[3/18]

🔸 Indicator Link
🔸 Click on the below 𝘭𝘪𝘯𝘬 -> 𝘈𝘥𝘥 𝘵𝘰 𝘍𝘢𝘷𝘰𝘶𝘳𝘪𝘵𝘦𝘴 -> 𝘈𝘥𝘥 𝘰𝘯 𝘊𝘩𝘢𝘳𝘵 from favourites and start using it !
🔸 https://t.co/zVXavqLBto
[4/18]
𝗜𝗻𝗱𝗶𝗰𝗮𝘁𝗼𝗿 𝗦𝗲𝘁𝘁𝗶𝗻𝗴𝘀 :
🔸 Max 6 Trades per day ( Both CE and PE buy)
🔸 Timings 9:20 am to 3:00 pm
🔸 Supertrend : 10,3
🔸 Moving Average 50 ema
[5/18]

Complete Backtest and Indicator link
🧵 A Thread 🧵
𝗦𝗲𝘁𝘂𝗽:
🔸 Monthly Option Buying
🔸 50 ema on 3 min timeframe
🔸 Supertrend 10 , 3
🔸 Chart : Banknifty , Nifty Futures as we backtested on futures
🔸 Entry 9:20 to 3:00
🔸 Max 3 Entries per day
🔸 Premium nearest to 200 Rs only
[2/18]
Why Monthly Option buying ?
🔸 Less theta decay compared to weekly options
🔸 Less Volatility
🔸 Supertrend and MA Settings
[3/18]
🔸 Indicator Link
🔸 Click on the below 𝘭𝘪𝘯𝘬 -> 𝘈𝘥𝘥 𝘵𝘰 𝘍𝘢𝘷𝘰𝘶𝘳𝘪𝘵𝘦𝘴 -> 𝘈𝘥𝘥 𝘰𝘯 𝘊𝘩𝘢𝘳𝘵 from favourites and start using it !
🔸 https://t.co/zVXavqLBto
[4/18]
𝗜𝗻𝗱𝗶𝗰𝗮𝘁𝗼𝗿 𝗦𝗲𝘁𝘁𝗶𝗻𝗴𝘀 :
🔸 Max 6 Trades per day ( Both CE and PE buy)
🔸 Timings 9:20 am to 3:00 pm
🔸 Supertrend : 10,3
🔸 Moving Average 50 ema
[5/18]
You May Also Like


1/OK, data mystery time.
This New York Times feature shows China with a Gini Index of less than 30, which would make it more equal than Canada, France, or the Netherlands. https://t.co/g3Sv6DZTDE
That's weird. Income inequality in China is legendary.
Let's check this number.
2/The New York Times cites the World Bank's recent report, "Fair Progress? Economic Mobility across Generations Around the World".
The report is available here:
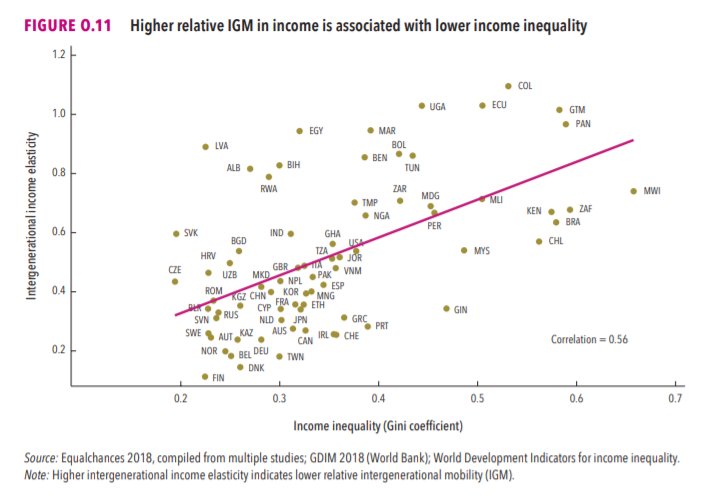
3/The World Bank report has a graph in which it appears to show the same value for China's Gini - under 0.3.
The graph cites the World Development Indicators as its source for the income inequality data.
4/The World Development Indicators are available at the World Bank's website.
Here's the Gini index: https://t.co/MvylQzpX6A
It looks as if the latest estimate for China's Gini is 42.2.
That estimate is from 2012.
5/A Gini of 42.2 would put China in the same neighborhood as the U.S., whose Gini was estimated at 41 in 2013.
I can't find the <30 number anywhere. The only other estimate in the tables for China is from 2008, when it was estimated at 42.8.
This New York Times feature shows China with a Gini Index of less than 30, which would make it more equal than Canada, France, or the Netherlands. https://t.co/g3Sv6DZTDE
That's weird. Income inequality in China is legendary.
Let's check this number.
2/The New York Times cites the World Bank's recent report, "Fair Progress? Economic Mobility across Generations Around the World".
The report is available here:
3/The World Bank report has a graph in which it appears to show the same value for China's Gini - under 0.3.
The graph cites the World Development Indicators as its source for the income inequality data.
4/The World Development Indicators are available at the World Bank's website.
Here's the Gini index: https://t.co/MvylQzpX6A
It looks as if the latest estimate for China's Gini is 42.2.
That estimate is from 2012.
5/A Gini of 42.2 would put China in the same neighborhood as the U.S., whose Gini was estimated at 41 in 2013.
I can't find the <30 number anywhere. The only other estimate in the tables for China is from 2008, when it was estimated at 42.8.
