But first, do you know the definition of a bear market?
When any index falls 20% or more from it's all time high, it is termed to be in a #bearmarket 🐻
How do you calculate length of a bear market? The time duration in days from previous all-time high to market bottom.
2/n
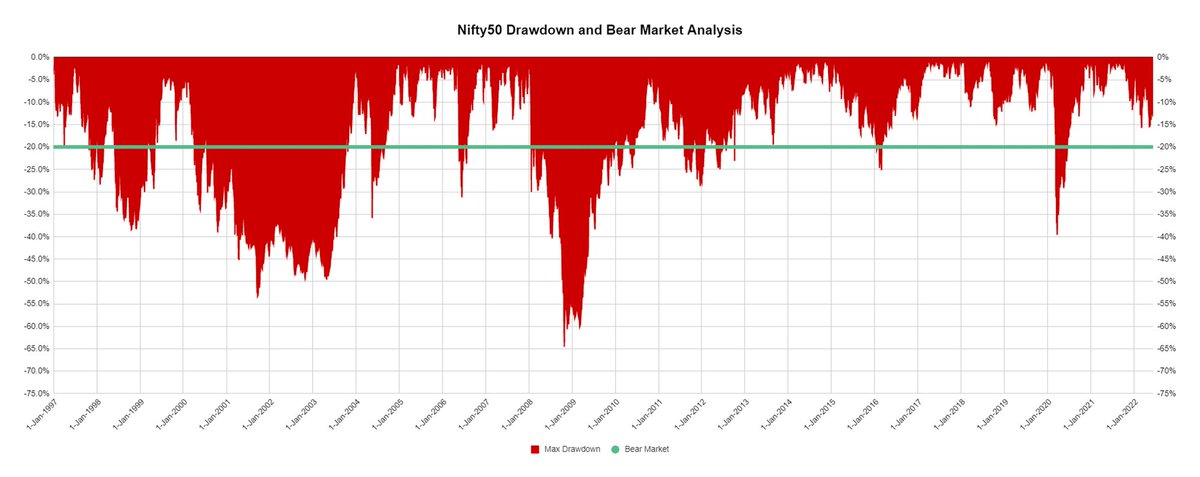
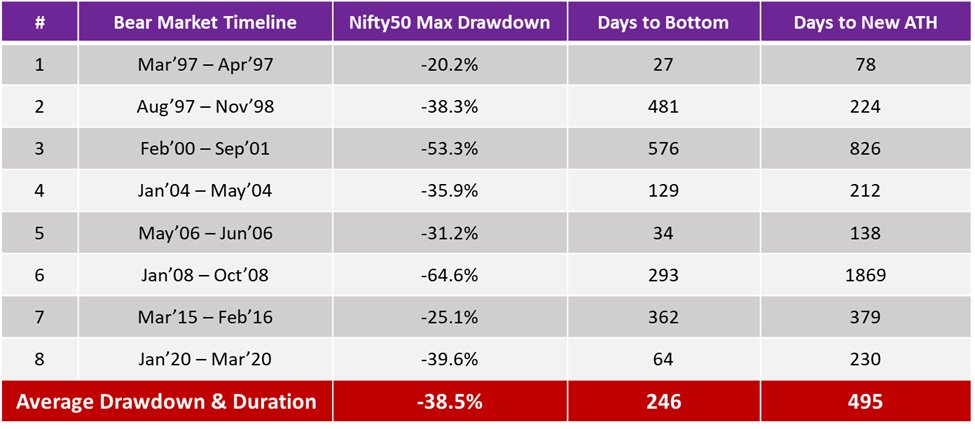
🇮🇳 Nifty last 25 years (1997-2022*)
Number of Bear Markets = 8
Average drawdown % = -38.5%
Average bear market duration = 246 days (8 m)
Key takeaway - Bear markets occur every ~3 years and take on average 8 months to bottom
3/n
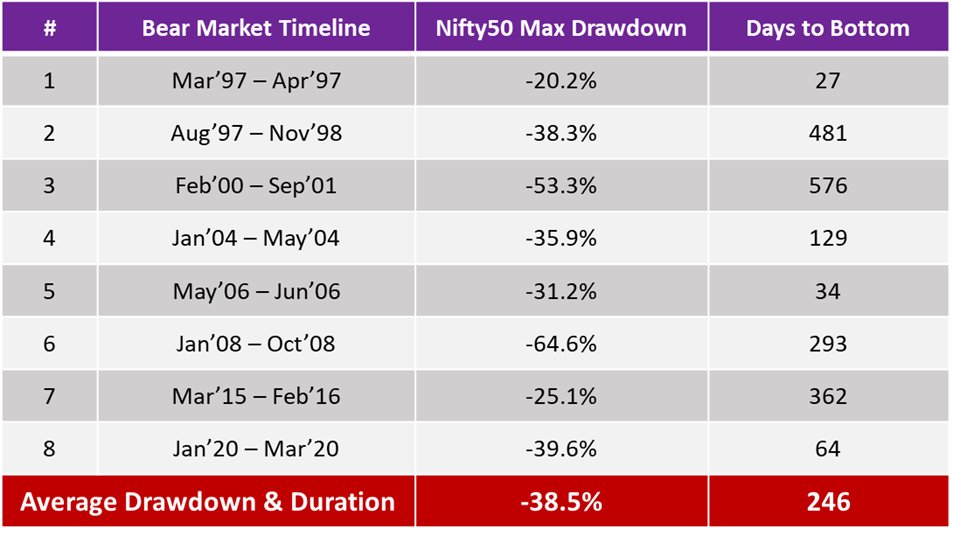
1997 and 2006 saw the fastest bear markets with Nifty correcting 20-30% in just ~1 month.
Unbelievably, 1997 had 2 bear markets! Just imagine suffering 20% drawdowns twice in a few months!
Mar 2020 Covid crash was the 3rd fastest and 3rd worst bear market.
4/n
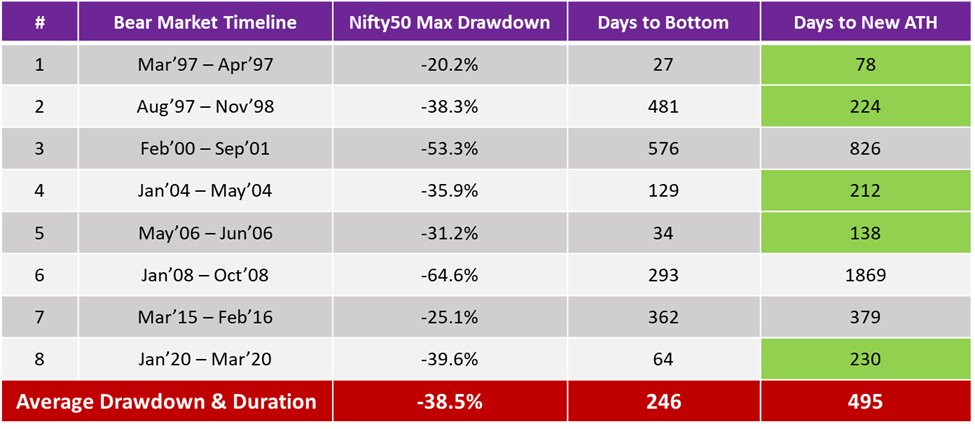
Okay, how should we define Bear Market Recovery?
The no of days from market bottom to a new all-time high.
Sadly, bear markets take time to recover.
Almost double the time to recover to a new ATH compared to the time to form a bottom.
Avg recovery duration – 495 days
5/n
Every cloud has a silver lining.
495 days or 16 months is the avg bear market recovery duration but they have been as short as 78 days (1997) or 138 days (2006).
5 out of 8 bear markets recovered within 8 months
Takeaway – Most bear markets recover within a year
6/n
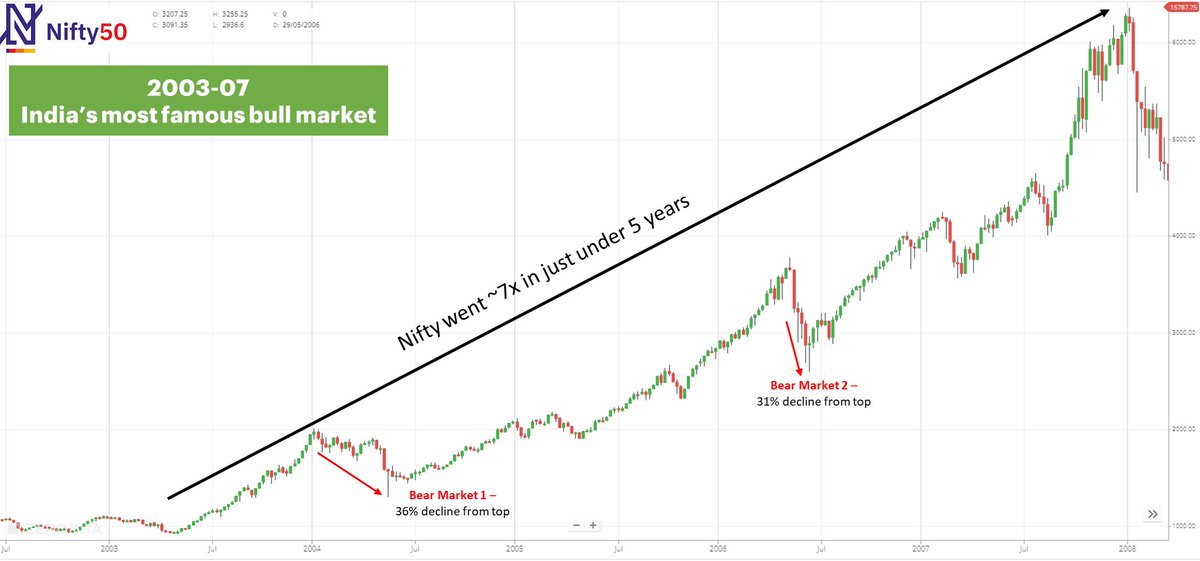
Bull Markets 🐂 have Bear Phases 🐻
We have all heard about 2003-07 bull market.
Nifty went ~7x in 5 years
April 2003 - 920
Jan 2008 - 6357
But even one of India's biggest bull markets had 2 bear markets in 2004 and 2006.
Bull markets never go up in a straight line.
7/n
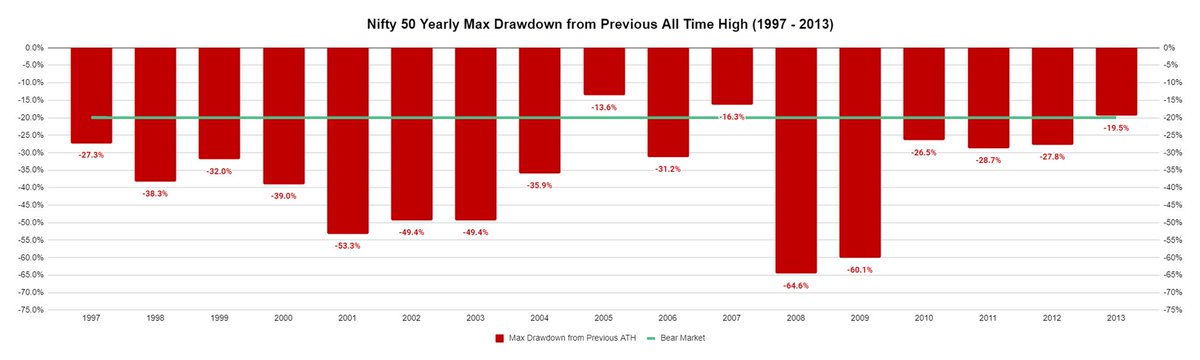
Key Question - So do you need to wait ~3 years for a bear market to buy equities?
The answer to this question has gradually changed in the past 25 years.
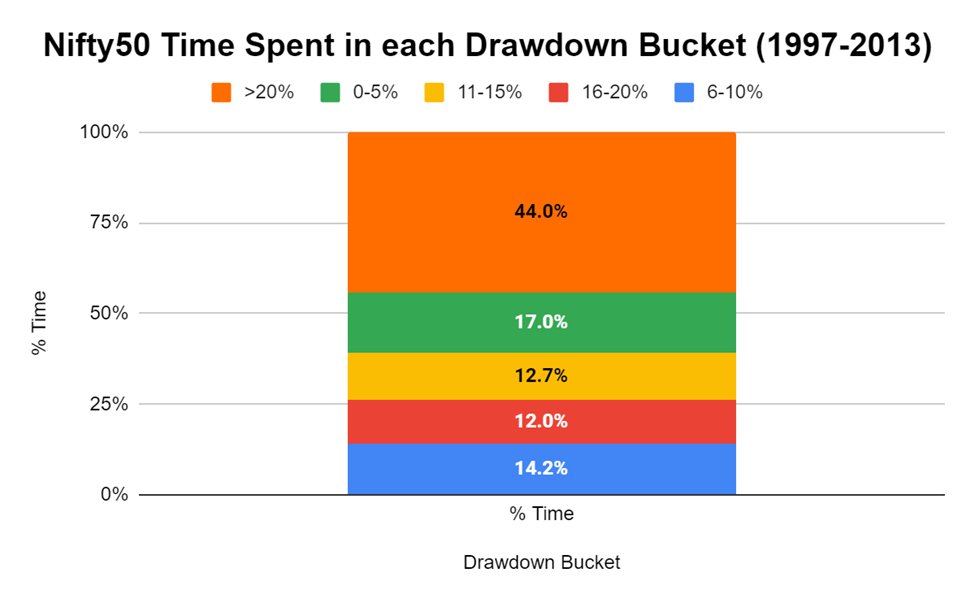
Between 1997-2013, the market was in bear market territory every single year barring just 2 years.
8/n
You will hardly believe the next insight given how strong India's markets have been in the recent past.
But in a span of 17 years between 1997-2013, our markets spent close to ~50% time in bear market (20%+ decline) territory.
9/n
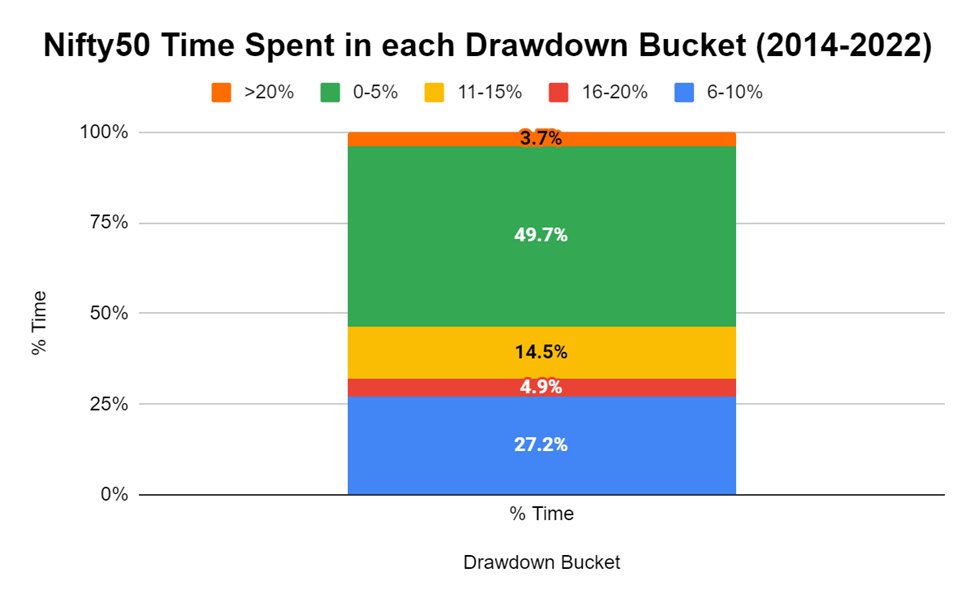
However, since 2013 🇮🇳 markets have been extremely resilient with just 2 bear markets in 9 years.
Complete opposite to above chart, Nifty has spent 50% time in last 9 years near ATHs.
And spent just 4% time in bear market territory
10/n
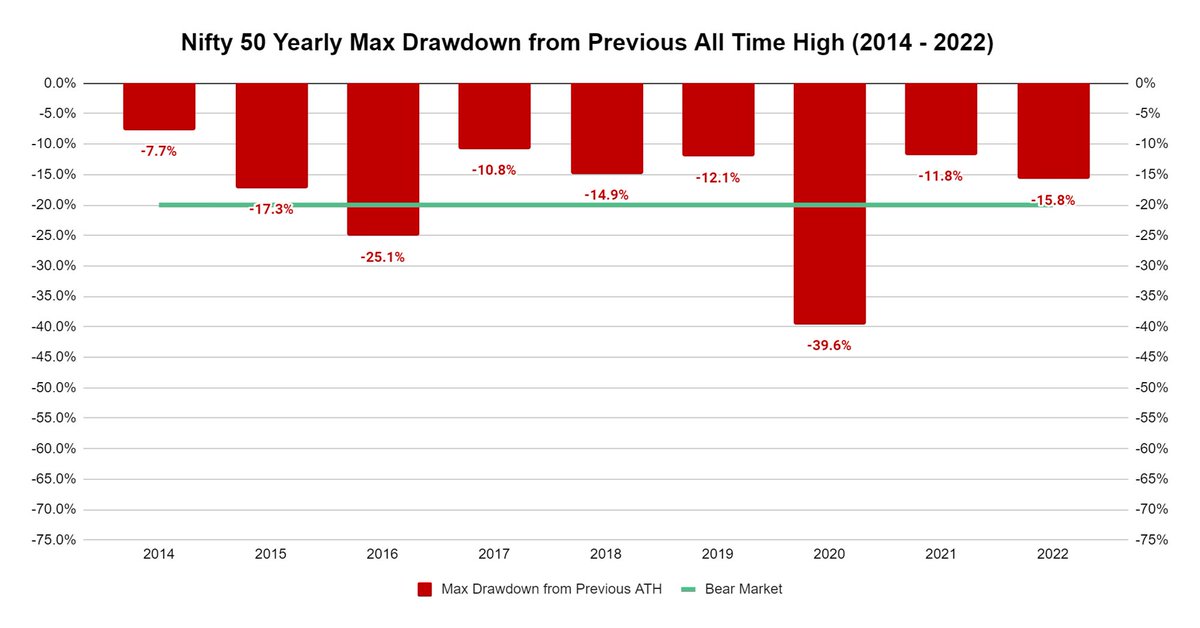
In the last 8.5 years, markets have corrected ~15% every other year and I cannot predict if the 25-30% frequent drawdowns between 1997-2013 will become the norm anytime soon.
So, 15%+ declines from ATH can be used as a good metric to increase equity allocation in my view.
11/n
This thread took me 15+ hours of research and writing, so please retweet if you find it useful.
I will create a separate thread for bear markets in small caps if this thread gets enough traction.
Summary and Learnings of last 25 years of Bear Markets in 🇮🇳👇
12/n
Bear Market Summary
1. 🐻 occurs every ~3 years and avg 8 months to bottom
2. 🇮🇳 has only seen 2 bear markets in last 9 years
3. 🐻 recoveries take double the time (16 months)
4. Bull 🐂 markets can have multiple 🐻 phases
5. Increase equity allocation on 15%+ declines
END