Thread on sideways market:
Sideways price action or consolidation is a phase where institutional players are silently building their positions transacting in smaller quantities.
(1/n)
Instead it results in a sideways price action.
When you see sideways action, do not think of it as boring but remind yourself that market is preparing itself for the next leg of move.
Trading decisions can be taken when price BO/BD such areas of VP.
More from Killer Trader 📉📈


Nifty basic volume profile analysis for today:
Yesterday, shared about various types of volume profile analysis and how to prepare for next day. Read here
We had discussed that a "p" shaped profile and close at highs indicates longs are in control of the market.
It also indicates high chances of uptrend continuation next day.
But
(2/n)
How to trade a failure of trend continuation? Yesterday, we saw a "P" shape profile in Nifty and close at highs.
But we failed to continue upmove today.
(3/n)
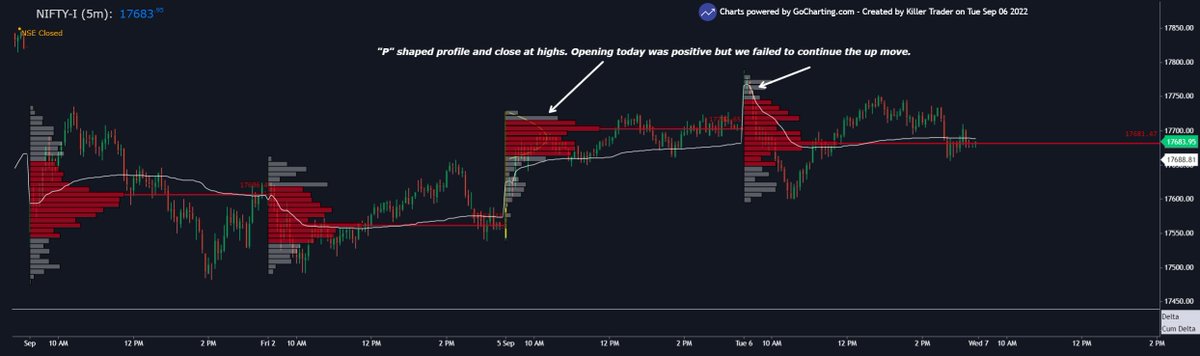
We opened positive but the opening breakout not sustaining is first cue to understand that bulls are lacking initiative to push prices up further.
(4/n)
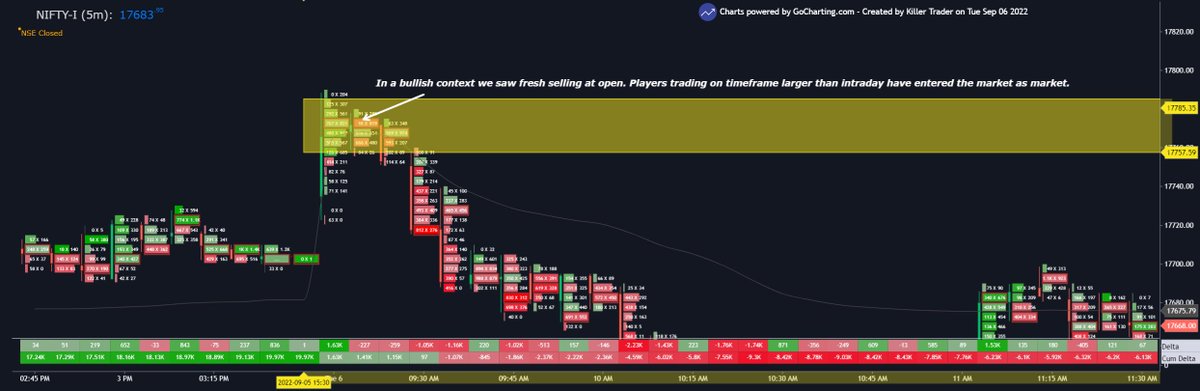
For confirmation, one can use orderflow as well to see real time supply demand flowing into the market.
At open today, we saw fresh sellers coming in a bullish opening.
(5/n)
Yesterday, shared about various types of volume profile analysis and how to prepare for next day. Read here
How to analyze Nifty using various types of volume profile:
— Trader Abhishek (@KillerTrader_) September 5, 2022
A thread \U0001f9f5
(1/n)
We had discussed that a "p" shaped profile and close at highs indicates longs are in control of the market.
It also indicates high chances of uptrend continuation next day.
But
(2/n)
How to trade a failure of trend continuation? Yesterday, we saw a "P" shape profile in Nifty and close at highs.
But we failed to continue upmove today.
(3/n)
We opened positive but the opening breakout not sustaining is first cue to understand that bulls are lacking initiative to push prices up further.
(4/n)
For confirmation, one can use orderflow as well to see real time supply demand flowing into the market.
At open today, we saw fresh sellers coming in a bullish opening.
(5/n)


More from Trading


TradingView isn't just charts
It's much more powerful than you think
9 things TradingView can do, you'll wish you knew yesterday: 🧵
Collaborated with @niki_poojary
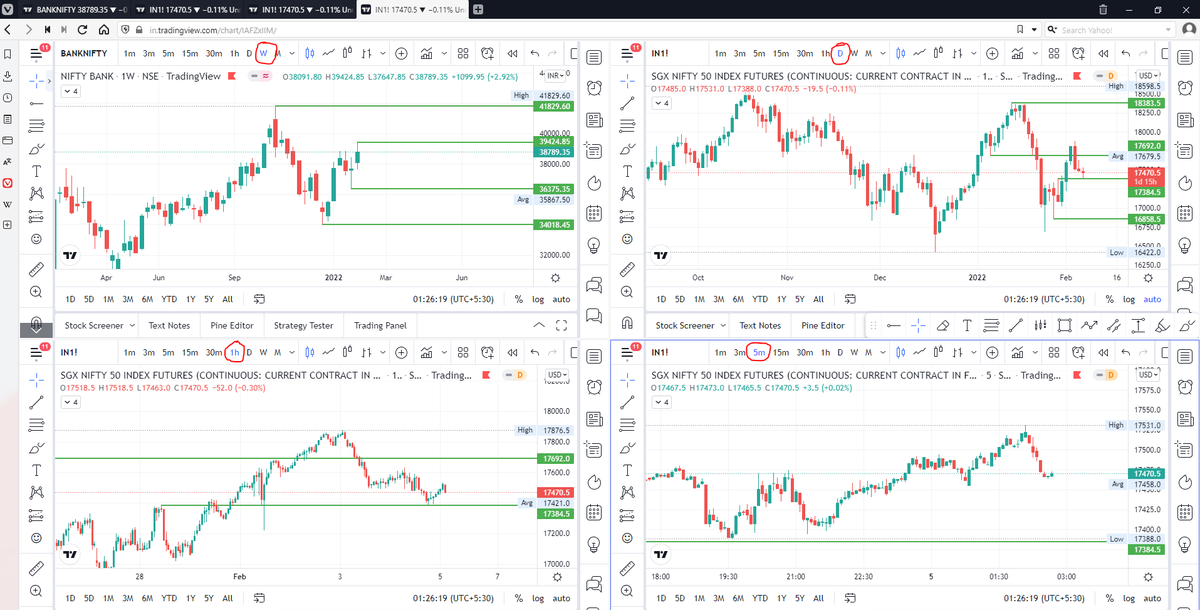
1/ Free Multi Timeframe Analysis
Step 1. Download Vivaldi Browser
Step 2. Login to trading view
Step 3. Open bank nifty chart in 4 separate windows
Step 4. Click on the first tab and shift + click by mouse on the last tab.
Step 5. Select "Tile all 4 tabs"
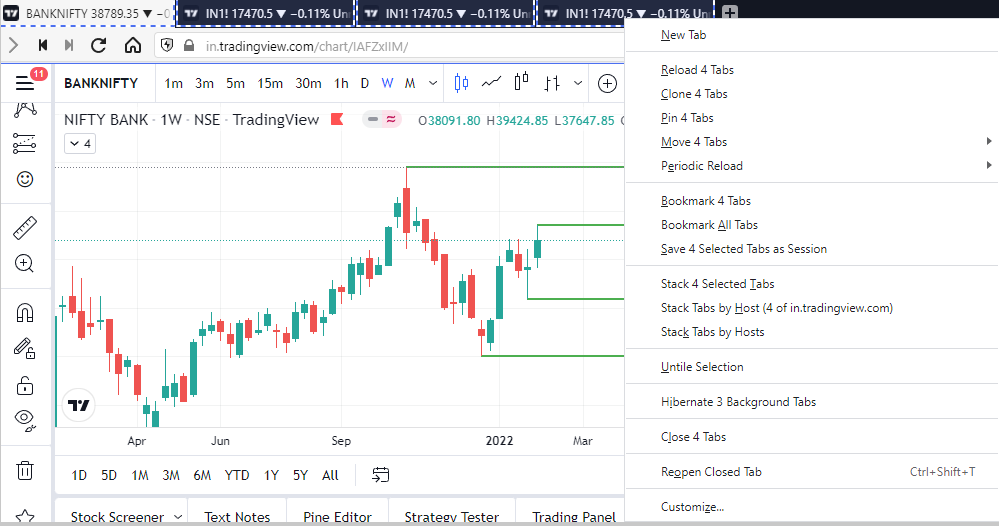
What happens is you get 4 charts joint on one screen.
Refer to the attached picture.
The best part about this is this is absolutely free to do.
Also, do note:
I do not have the paid version of trading view.
2/ Free Multiple Watchlists
Go through this informative thread where @sarosijghosh teaches you how to create multiple free watchlists in the free
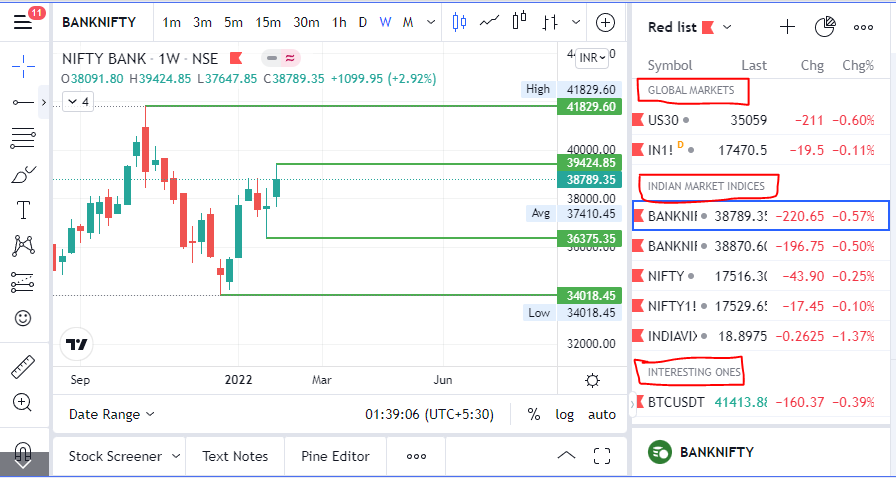
3/ Free Segregation into different headers/sectors
You can create multiple sections sector-wise for free.
1. Long tap on any index/stock and click on "Add section above."
2. Secgregate the stocks/indices based on where they belong.
Kinda like how I did in the picture below.
It's much more powerful than you think
9 things TradingView can do, you'll wish you knew yesterday: 🧵
Collaborated with @niki_poojary
1/ Free Multi Timeframe Analysis
Step 1. Download Vivaldi Browser
Step 2. Login to trading view
Step 3. Open bank nifty chart in 4 separate windows
Step 4. Click on the first tab and shift + click by mouse on the last tab.
Step 5. Select "Tile all 4 tabs"
What happens is you get 4 charts joint on one screen.
Refer to the attached picture.
The best part about this is this is absolutely free to do.
Also, do note:
I do not have the paid version of trading view.
2/ Free Multiple Watchlists
Go through this informative thread where @sarosijghosh teaches you how to create multiple free watchlists in the free
\U0001d5e0\U0001d602\U0001d5f9\U0001d601\U0001d5f6\U0001d5fd\U0001d5f9\U0001d5f2 \U0001d600\U0001d5f2\U0001d5f0\U0001d601\U0001d5fc\U0001d5ff \U0001d604\U0001d5ee\U0001d601\U0001d5f0\U0001d5f5\U0001d5f9\U0001d5f6\U0001d600\U0001d601 \U0001d5fc\U0001d5fb \U0001d5e7\U0001d5ff\U0001d5ee\U0001d5f1\U0001d5f6\U0001d5fb\U0001d5f4\U0001d603\U0001d5f6\U0001d5f2\U0001d604 \U0001d602\U0001d600\U0001d5f6\U0001d5fb\U0001d5f4 \U0001d601\U0001d5f5\U0001d5f2 \U0001d5d9\U0001d5e5\U0001d5d8\U0001d5d8 \U0001d603\U0001d5f2\U0001d5ff\U0001d600\U0001d5f6\U0001d5fc\U0001d5fb!
— Sarosij Ghosh (@sarosijghosh) September 18, 2021
A THREAD \U0001f9f5
Please Like and Re-Tweet. It took a lot of effort to put this together. #StockMarket #TradingView #trading #watchlist #Nifty500 #stockstowatch
3/ Free Segregation into different headers/sectors
You can create multiple sections sector-wise for free.
1. Long tap on any index/stock and click on "Add section above."
2. Secgregate the stocks/indices based on where they belong.
Kinda like how I did in the picture below.