Thread on sideways market:
Sideways price action or consolidation is a phase where institutional players are silently building their positions transacting in smaller quantities.
(1/n)
Instead it results in a sideways price action.
When you see sideways action, do not think of it as boring but remind yourself that market is preparing itself for the next leg of move.
Trading decisions can be taken when price BO/BD such areas of VP.
More from Killer Trader 📉📈


Nifty basic volume profile analysis for today:
Yesterday, shared about various types of volume profile analysis and how to prepare for next day. Read here
We had discussed that a "p" shaped profile and close at highs indicates longs are in control of the market.
It also indicates high chances of uptrend continuation next day.
But
(2/n)
How to trade a failure of trend continuation? Yesterday, we saw a "P" shape profile in Nifty and close at highs.
But we failed to continue upmove today.
(3/n)
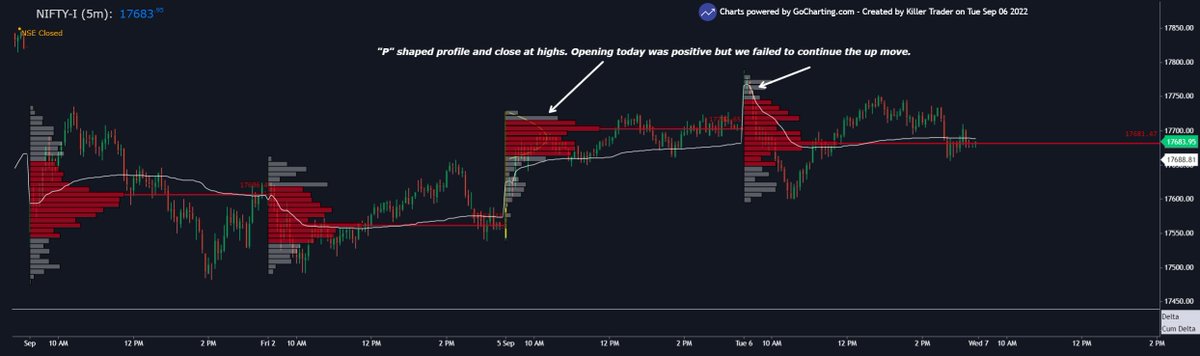
We opened positive but the opening breakout not sustaining is first cue to understand that bulls are lacking initiative to push prices up further.
(4/n)
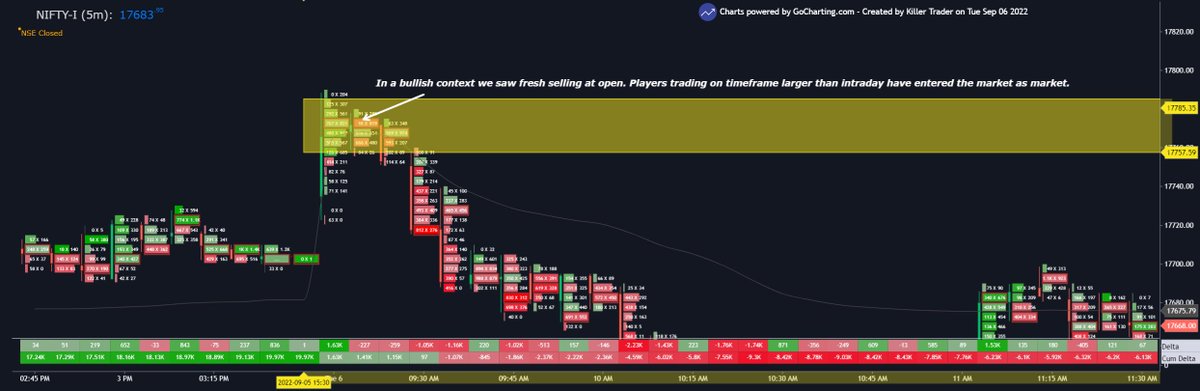
For confirmation, one can use orderflow as well to see real time supply demand flowing into the market.
At open today, we saw fresh sellers coming in a bullish opening.
(5/n)
Yesterday, shared about various types of volume profile analysis and how to prepare for next day. Read here
How to analyze Nifty using various types of volume profile:
— Trader Abhishek (@KillerTrader_) September 5, 2022
A thread \U0001f9f5
(1/n)
We had discussed that a "p" shaped profile and close at highs indicates longs are in control of the market.
It also indicates high chances of uptrend continuation next day.
But
(2/n)
How to trade a failure of trend continuation? Yesterday, we saw a "P" shape profile in Nifty and close at highs.
But we failed to continue upmove today.
(3/n)
We opened positive but the opening breakout not sustaining is first cue to understand that bulls are lacking initiative to push prices up further.
(4/n)
For confirmation, one can use orderflow as well to see real time supply demand flowing into the market.
At open today, we saw fresh sellers coming in a bullish opening.
(5/n)
More from Trading


Option Trading is very difficult to master as there are so many things to understand.
Here is a master thread related that will help a beginner to understand about Options Trading.
A complete course worth Rs 50K for free.
1/ A detailed thread on basics of Option Greeks and how it impacts Options
2/ Basic Option Trading Strategies:
There are many option strategies to trade. But keeping your strategy simple is the key.
In this thread, all the basic option trading strategies are being
3/ What are the things that you should look at before taking any Option
4/ Is Option Selling Possible with Rs 1 Lakh Capital?
Even a beginner can start trading in option selling with capital as low as Rs 1 Lakh.
What are the techniques one can use and how to mitigate the infinite loss risk is shared in this
Here is a master thread related that will help a beginner to understand about Options Trading.
A complete course worth Rs 50K for free.
1/ A detailed thread on basics of Option Greeks and how it impacts Options
There are various Options Greeks like: Delta, Gamma, Vega, Rho, Theta.
— Yash Mehta (@YMehta_) September 4, 2022
A complete guide on how these #Option Greeks impact option price.
2/ Basic Option Trading Strategies:
There are many option strategies to trade. But keeping your strategy simple is the key.
In this thread, all the basic option trading strategies are being
Option trading is tough but here\u2019s what can make it easier for you
— The Chartians (@chartians) September 17, 2022
8 option strategies that you can use in any market (sold as a \u20b9 50,000 course !)
3/ What are the things that you should look at before taking any Option
They say options trading can make YOU BANKRUPT - is it true ?
— The Chartians (@chartians) September 23, 2022
If yes then why ?
A thread on Risk management and Position sizing in options trading (worth 50k\u20b9 course)\U0001f9f5
4/ Is Option Selling Possible with Rs 1 Lakh Capital?
Even a beginner can start trading in option selling with capital as low as Rs 1 Lakh.
What are the techniques one can use and how to mitigate the infinite loss risk is shared in this
101 guide on how you can start option selling to generate active returns with less capital (Rs 1 Lakh) \U0001f9f5:
— Yash Mehta (@YMehta_) August 19, 2022
A course on option selling available for free.