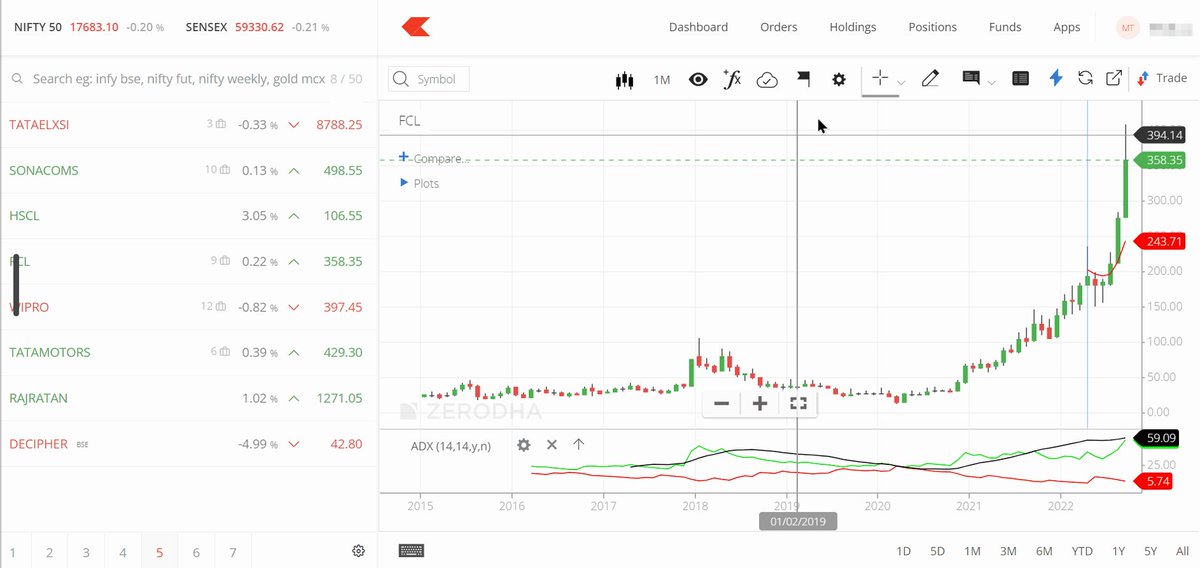
Good Saturday Morning Chart Fans!
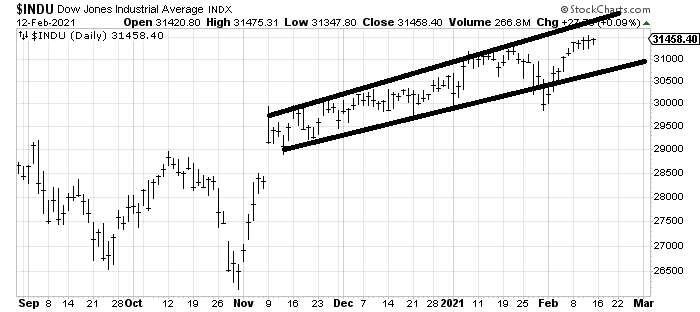
Will I have to learn to draw vertical lines with no slope? Let's have a look!
More from Trading
12 TRADING SETUPS used by professional traders:🧵
Collaborated with @niki_poojary
Here's what you'll learn in this thread:
1. Capture Overnight Theta Decay
2. Trading Opening Range Breakouts
3. Reversal Trading Setups
4. Selling strangles and straddles in Bank Nifty
6. NR4 + IB
7. NR 21-Vwap Strategy
Let's dive in ↓
1/ STBT option Selling (Positional Setup):
The setup uses price action to sell options for overnight theta decay.
Check Bank Nifty at 3:15 everyday.
Sell directional credit spreads with capped
@jigspatel1988 2/ Selling Strangles in Bank Nifty based on Open Interest Data
Don't trade till 9:45 Am.
Identify the highest OI on puts and calls.
Check combined premium and put a stop on individual
@jigspatel1988 3/ Open Drive (Intraday)
This is an opening range breakout setup with a few conditions.
To be used when the market opens above yesterday's day high
or Below yesterday's day's
Collaborated with @niki_poojary
Here's what you'll learn in this thread:
1. Capture Overnight Theta Decay
2. Trading Opening Range Breakouts
3. Reversal Trading Setups
4. Selling strangles and straddles in Bank Nifty
6. NR4 + IB
7. NR 21-Vwap Strategy
Let's dive in ↓
1/ STBT option Selling (Positional Setup):
The setup uses price action to sell options for overnight theta decay.
Check Bank Nifty at 3:15 everyday.
Sell directional credit spreads with capped
A thread about STBT options selling,
— Jig's Patel (@jigspatel1988) July 17, 2021
The purpose is simple to capture overnight theta decay,
Generally, ppl sell ATM straddle with hedge or sell naked options,
But I am using Today\u2019s price action for selling options in STBT,
(1/n)
@jigspatel1988 2/ Selling Strangles in Bank Nifty based on Open Interest Data
Don't trade till 9:45 Am.
Identify the highest OI on puts and calls.
Check combined premium and put a stop on individual
Thread on
— Jig's Patel (@jigspatel1988) July 4, 2021
"Intraday Banknifty Strangle based on OI data"
(System already shared, today just share few examples)
(1/n)
@jigspatel1988 3/ Open Drive (Intraday)
This is an opening range breakout setup with a few conditions.
To be used when the market opens above yesterday's day high
or Below yesterday's day's
#OpenDrive#intradaySetup
— Pathik (@Pathik_Trader) April 16, 2019
Sharing one high probability trending setup for intraday.
Few conditions needs to be met
1. Opening should be above/below previous day high/low for buy/sell setup.
2. Open=low (for buy)
Open=high (for sell)
(1/n)
You May Also Like
So friends here is the thread on the recommended pathway for new entrants in the stock market.
Here I will share what I believe are essentials for anybody who is interested in stock markets and the resources to learn them, its from my experience and by no means exhaustive..
First the very basic : The Dow theory, Everybody must have basic understanding of it and must learn to observe High Highs, Higher Lows, Lower Highs and Lowers lows on charts and their
Even those who are more inclined towards fundamental side can also benefit from Dow theory, as it can hint start & end of Bull/Bear runs thereby indication entry and exits.
Next basic is Wyckoff's Theory. It tells how accumulation and distribution happens with regularity and how the market actually
Dow theory is old but
Here I will share what I believe are essentials for anybody who is interested in stock markets and the resources to learn them, its from my experience and by no means exhaustive..
First the very basic : The Dow theory, Everybody must have basic understanding of it and must learn to observe High Highs, Higher Lows, Lower Highs and Lowers lows on charts and their
Even those who are more inclined towards fundamental side can also benefit from Dow theory, as it can hint start & end of Bull/Bear runs thereby indication entry and exits.
Next basic is Wyckoff's Theory. It tells how accumulation and distribution happens with regularity and how the market actually
Dow theory is old but
Old is Gold....
— Professor (@DillikiBiili) January 23, 2020
this Bharti Airtel chart is a true copy of the Wyckoff Pattern propounded in 1931....... pic.twitter.com/tQ1PNebq7d