
Want to see two absolutely crazy, shady, frustrating charts? (warning: they're confusing, I'll explain)
These charts, which show stock price, volume, short interest, and short volume, tell the story of what happened over the past few days.
Left: $AMC, Right: $GME
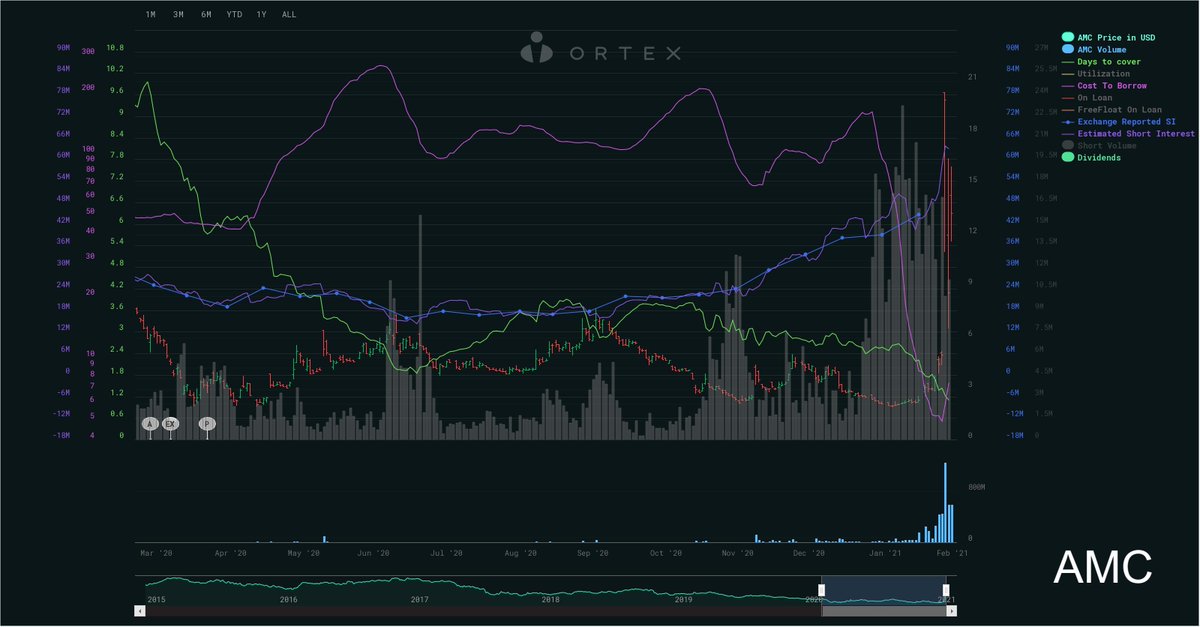
On Wednesday night, the requirements for certain extremely volatile stocks like GME skyrocketed.
Something like 50% of RH traders were/are holding GME.
Even so, they limited trading of these tickers (stocks).
And short sellers took advantage of this. When the prices fell, a ton of them closed out their high-cost GME position.
More from Trading

FREE MINI STOCK MBA
If you wish to learn abt trading,psychology,options,business etc
You can go through this thread.
Other than this I do post videos on my YT channel : -Abhishek Kar & Tradiostation
-Intraday views on FREE telegram : Abhishek Kar Official
RT will be appreciated
1. Threads to learn Options
https://t.co/wabkek43I8
2. https://t.co/OIDenHKdWN
3. Some core rules to investing
https://t.co/37d1pygp7P
4.Summing up 2020 Trading lessons
https://t.co/jSUb1lSGbQ
5.Effects of margin change on
6. Exciting story about a trader who destroyed a Bank
https://t.co/CsEEhIsD3q
7. Some Thought Provoking facts about stock markets
https://t.co/IjxpX5Wx24
8. A dose on Trading and investing
9. Top 5 resources to learn everything about stocks
https://t.co/6KnIySBGIG
10. Some Pro Tips on Trading
https://t.co/EiSGikt7jv
11. Wisdom on stuffs you should not do
https://t.co/bI2dH0XTSS
12. Reasons why you are losing the
13. The DARK side of stock market
https://t.co/qsteGcbquI
14. Stocks where you should NOT invest
https://t.co/2tD5q0K3UQ
15. Lessons from MILLIONAIRE trader
https://t.co/Pec6LmUtGa
16. Lessons from my
If you wish to learn abt trading,psychology,options,business etc
You can go through this thread.
Other than this I do post videos on my YT channel : -Abhishek Kar & Tradiostation
-Intraday views on FREE telegram : Abhishek Kar Official
RT will be appreciated
1. Threads to learn Options
https://t.co/wabkek43I8
2. https://t.co/OIDenHKdWN
3. Some core rules to investing
https://t.co/37d1pygp7P
4.Summing up 2020 Trading lessons
https://t.co/jSUb1lSGbQ
5.Effects of margin change on
\U0001d413\U0001d421\U0001d42b\U0001d41e\U0001d41a\U0001d41d \U0001d41f\U0001d428\U0001d42b \U0001d40e\U0001d429\U0001d42d\U0001d422\U0001d428\U0001d427\U0001d42c
— Abhishek Kar (@Abhishekkar_) December 29, 2020
The entire thread will have some quick pointers on options trading. These bullet points are based on experience and learning and even if you are completely new,will help you to build some perspective. So,lets go :
6. Exciting story about a trader who destroyed a Bank
https://t.co/CsEEhIsD3q
7. Some Thought Provoking facts about stock markets
https://t.co/IjxpX5Wx24
8. A dose on Trading and investing
\U0001d413\U0001d42b\U0001d41a\U0001d41d\U0001d41e\U0001d42b \U0001d430\U0001d421\U0001d428 \U0001d41d\U0001d41e\U0001d42c\U0001d42d\U0001d42b\U0001d428\U0001d432\U0001d41e\U0001d41d \U0001d401\U0001d41a\U0001d42b\U0001d422\U0001d427\U0001d420\U0001d42c \U0001d401\U0001d41a\U0001d427\U0001d424
— Abhishek Kar (@Abhishekkar_) October 11, 2020
This thread is about the trader who with his reckless trading destroyed the entire Barings bank. In case you would like to read more such informative threads,do not forget to retweet and share as acts as encouragement
9. Top 5 resources to learn everything about stocks
https://t.co/6KnIySBGIG
10. Some Pro Tips on Trading
https://t.co/EiSGikt7jv
11. Wisdom on stuffs you should not do
https://t.co/bI2dH0XTSS
12. Reasons why you are losing the
\U0001d5e7\U0001d5db\U0001d5d8 \U0001d5e7\U0001d5e2\U0001d5e3 \U0001d7f1 \U0001d5e7\U0001d5db\U0001d5e5\U0001d5d8\U0001d5d4\U0001d5d7
— Abhishek Kar (@Abhishekkar_) July 21, 2020
The following thread will have top 5 for everything you need in the world of stock market and as learner who wants to REALLY grow. Make sure you #retweet the thread and let it reach the maximum number of people as sharing is caring.
13. The DARK side of stock market
https://t.co/qsteGcbquI
14. Stocks where you should NOT invest
https://t.co/2tD5q0K3UQ
15. Lessons from MILLIONAIRE trader
https://t.co/Pec6LmUtGa
16. Lessons from my
\U0001d5e7\U0001d5db\U0001d5d8 \U0001d5d7\U0001d5d4\U0001d5e5\U0001d5de \U0001d5e6\U0001d5dc\U0001d5d7\U0001d5d8 \U0001d5e2\U0001d5d9 \U0001d5e6\U0001d5e7\U0001d5e2\U0001d5d6\U0001d5de \U0001d5e7\U0001d5e5\U0001d5d4\U0001d5d7\U0001d5dc\U0001d5e1\U0001d5da
— Abhishek Kar (@Abhishekkar_) July 6, 2020
In the following thread you will understand a few dark truths about stock trading as a profession.
Sadly everyone touches the only green side but there has to be a balance. Don't forget to #retweet for wider reach.


You May Also Like


1/“What would need to be true for you to….X”
Why is this the most powerful question you can ask when attempting to reach an agreement with another human being or organization?
A thread, co-written by @deanmbrody:
2/ First, “X” could be lots of things. Examples: What would need to be true for you to
- “Feel it's in our best interest for me to be CMO"
- “Feel that we’re in a good place as a company”
- “Feel that we’re on the same page”
- “Feel that we both got what we wanted from this deal
3/ Normally, we aren’t that direct. Example from startup/VC land:
Founders leave VC meetings thinking that every VC will invest, but they rarely do.
Worse over, the founders don’t know what they need to do in order to be fundable.
4/ So why should you ask the magic Q?
To get clarity.
You want to know where you stand, and what it takes to get what you want in a way that also gets them what they want.
It also holds them (mentally) accountable once the thing they need becomes true.
5/ Staying in the context of soliciting investors, the question is “what would need to be true for you to want to invest (or partner with us on this journey, etc)?”
Multiple responses to this question are likely to deliver a positive result.
Why is this the most powerful question you can ask when attempting to reach an agreement with another human being or organization?
A thread, co-written by @deanmbrody:
Next level tactic when closing a sale, candidate, or investment:
— Erik Torenberg (@eriktorenberg) February 27, 2018
Ask: \u201cWhat needs to be true for you to be all in?\u201d
You'll usually get an explicit answer that you might not get otherwise. It also holds them accountable once the thing they need becomes true.
2/ First, “X” could be lots of things. Examples: What would need to be true for you to
- “Feel it's in our best interest for me to be CMO"
- “Feel that we’re in a good place as a company”
- “Feel that we’re on the same page”
- “Feel that we both got what we wanted from this deal
3/ Normally, we aren’t that direct. Example from startup/VC land:
Founders leave VC meetings thinking that every VC will invest, but they rarely do.
Worse over, the founders don’t know what they need to do in order to be fundable.
4/ So why should you ask the magic Q?
To get clarity.
You want to know where you stand, and what it takes to get what you want in a way that also gets them what they want.
It also holds them (mentally) accountable once the thing they need becomes true.
5/ Staying in the context of soliciting investors, the question is “what would need to be true for you to want to invest (or partner with us on this journey, etc)?”
Multiple responses to this question are likely to deliver a positive result.


So the cryptocurrency industry has basically two products, one which is relatively benign and doesn't have product market fit, and one which is malignant and does. The industry has a weird superposition of understanding this fact and (strategically?) not understanding it.
The benign product is sovereign programmable money, which is historically a niche interest of folks with a relatively clustered set of beliefs about the state, the literary merit of Snow Crash, and the utility of gold to the modern economy.
This product has narrow appeal and, accordingly, is worth about as much as everything else on a 486 sitting in someone's basement is worth.
The other product is investment scams, which have approximately the best product market fit of anything produced by humans. In no age, in no country, in no city, at no level of sophistication do people consistently say "Actually I would prefer not to get money for nothing."
This product needs the exchanges like they need oxygen, because the value of it is directly tied to having payment rails to move real currency into the ecosystem and some jurisdictional and regulatory legerdemain to stay one step ahead of the banhammer.
If everyone was holding bitcoin on the old x86 in their parents basement, we would be finding a price bottom. The problem is the risk is all pooled at a few brokerages and a network of rotten exchanges with counter party risk that makes AIG circa 2008 look like a good credit.
— Greg Wester (@gwestr) November 25, 2018
The benign product is sovereign programmable money, which is historically a niche interest of folks with a relatively clustered set of beliefs about the state, the literary merit of Snow Crash, and the utility of gold to the modern economy.
This product has narrow appeal and, accordingly, is worth about as much as everything else on a 486 sitting in someone's basement is worth.
The other product is investment scams, which have approximately the best product market fit of anything produced by humans. In no age, in no country, in no city, at no level of sophistication do people consistently say "Actually I would prefer not to get money for nothing."
This product needs the exchanges like they need oxygen, because the value of it is directly tied to having payment rails to move real currency into the ecosystem and some jurisdictional and regulatory legerdemain to stay one step ahead of the banhammer.