
Want to see two absolutely crazy, shady, frustrating charts? (warning: they're confusing, I'll explain)
These charts, which show stock price, volume, short interest, and short volume, tell the story of what happened over the past few days.
Left: $AMC, Right: $GME
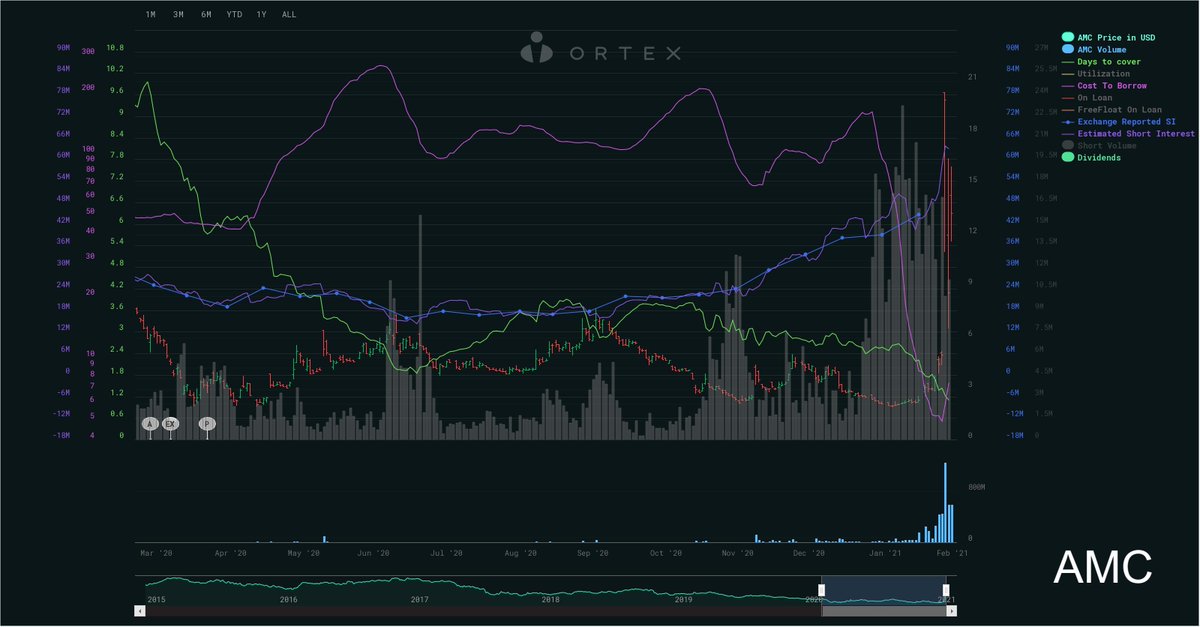
On Wednesday night, the requirements for certain extremely volatile stocks like GME skyrocketed.
Something like 50% of RH traders were/are holding GME.
Even so, they limited trading of these tickers (stocks).
And short sellers took advantage of this. When the prices fell, a ton of them closed out their high-cost GME position.
More from Trading


You May Also Like


Ivor Cummins has been wrong (or lying) almost entirely throughout this pandemic and got paid handsomly for it.
He has been wrong (or lying) so often that it will be nearly impossible for me to track every grift, lie, deceit, manipulation he has pulled. I will use...

... other sources who have been trying to shine on light on this grifter (as I have tried to do, time and again:
Example #1: "Still not seeing Sweden signal versus Denmark really"... There it was (Images attached).
19 to 80 is an over 300% difference.
Tweet: https://t.co/36FnYnsRT9

Example #2 - "Yes, I'm comparing the Noridcs / No, you cannot compare the Nordics."
I wonder why...
Tweets: https://t.co/XLfoX4rpck / https://t.co/vjE1ctLU5x

Example #3 - "I'm only looking at what makes the data fit in my favour" a.k.a moving the goalposts.
Tweets: https://t.co/vcDpTu3qyj / https://t.co/CA3N6hC2Lq

He has been wrong (or lying) so often that it will be nearly impossible for me to track every grift, lie, deceit, manipulation he has pulled. I will use...
... other sources who have been trying to shine on light on this grifter (as I have tried to do, time and again:
Ivor Cummins BE (Chem) is a former R&D Manager at HP (sourcre: https://t.co/Wbf5scf7gn), turned Content Creator/Podcast Host/YouTube personality. (Call it what you will.)
— Steve (@braidedmanga) November 17, 2020
Example #1: "Still not seeing Sweden signal versus Denmark really"... There it was (Images attached).
19 to 80 is an over 300% difference.
Tweet: https://t.co/36FnYnsRT9
Example #2 - "Yes, I'm comparing the Noridcs / No, you cannot compare the Nordics."
I wonder why...
Tweets: https://t.co/XLfoX4rpck / https://t.co/vjE1ctLU5x
Example #3 - "I'm only looking at what makes the data fit in my favour" a.k.a moving the goalposts.
Tweets: https://t.co/vcDpTu3qyj / https://t.co/CA3N6hC2Lq

