O'Neil was the founder of Investor's Business Daily and in 1964 he became the youngest person to ever purchase a seat on the New York Stock Exchange at age 30.
An Introduction to CANSLIM (Thread)
O'Neil was the founder of Investor's Business Daily and in 1964 he became the youngest person to ever purchase a seat on the New York Stock Exchange at age 30.
Current Quarterly Earnings Growth
Annual Earnings Growth
New Products/Services/Management/Price Highs
Supply and Demand
Leader Versus Laggard
Institutional Sponsorship
Market Direction
In terms of Current Quarterly Earnings, we are looking for increases over the same quarter in the prior year of at least 25%.
For this metric the higher the better and preferably there is also excellent sales growth and improving margins.
https://t.co/vBSMI1EUOM
For Annual Earnings Growth, we are looking for 25% growth over the past few years.
Also, look for turnaround stories, breakout years, and exceptional Annual EPS estimates for the current year and the next.
https://t.co/CjVu9Q0HCH
The New factor in CANSLIM is where the story of the company comes into play and this by itself can produce incredible appreciation in a company’s stock price.
Look for new and revolutionary products and services which change how we live our lives and with large total addressable markets.
The N also looks for stocks hitting new price all-time price highs which is a clear sign of a stock in demand
https://t.co/wAUzyIS9vx
Supply and demand is another key characteristic to consider when it comes to selecting high potential stocks.
It’s important to understand how the # of shares in the float affects a stock's price movements and how the price of a stock is determined.
To judge supply and demand we analyze price and volume charts to look for institutional footprints.
https://t.co/69Htt5DNhW
Determining whether a stock is a leader or a laggard is another important component of stock selection.
Here we are looking for Relative Strength signs and outperformance relative to the market even before an uptrend begins.
In short, we are looking for the leading stocks in the leading industry groups with excellent fundamentals as well as price and volume action
https://t.co/3SlaWOgEJM
For institutional sponsorship, we are watching for an increasing trend in the amount of fund ownership as well as high-quality growth funds with excellent track records starting positions.
These institutions have access to the best analysts and data available and once they begin accumulating shares we can ride the uptrend that their buying support creates.
https://t.co/pcRGPsOfrH
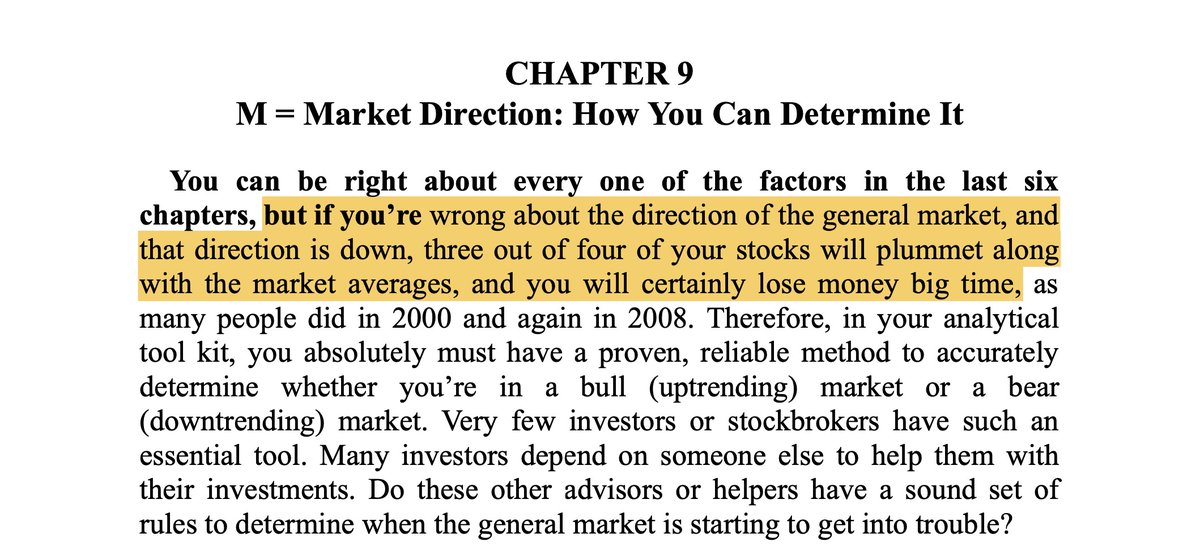
The most important component is the market since ¾ stocks follow the overall trend.
We need to be able to determine both when the tide is on our side and also when to take a step back from the markets and wait until conditions improve
https://t.co/1DsKU6dKxm
You may adapt certain criteria and find your own edges but it's certainly worth learning especially if you are new to the markets.
https://t.co/gRYACxAvhD
https://t.co/1HiN8dmV8C
Subscribe here ➡️ https://t.co/uIHLETz82r
More from TraderLion
More from Traderlion
How to time the market (thread)
There is the old saying that “Time in the market beats timing the market” The chart below from Dr. Wish’s @WishingWealth presentation at the @TraderLion_ conference shows that to be false.
Full presentation: https://t.co/o2f21GBXci
The green line is unattainable realistically, however, missing volatile times during corrections yields better performance than buy and hold and we can aim for the green line.
Investors usually only show the gray and red results.
More
There are many strategies for investing/trading in the stock market operating within different timeframes and with different objectives.
That is of course what creates a market and opportunity. Timing the market may not be what works for you or what fits your goals/lifestyle.
However, everyone involved in the market is here to make money over time and corrections can cause huge drawdowns in the high alpha names negating incredible performance during strong market uptrends.
You May Also Like
A brief analysis and comparison of the CSS for Twitter's PWA vs Twitter's legacy desktop website. The difference is dramatic and I'll touch on some reasons why.
Legacy site *downloads* ~630 KB CSS per theme and writing direction.
6,769 rules
9,252 selectors
16.7k declarations
3,370 unique declarations
44 media queries
36 unique colors
50 unique background colors
46 unique font sizes
39 unique z-indices
https://t.co/qyl4Bt1i5x
PWA *incrementally generates* ~30 KB CSS that handles all themes and writing directions.
735 rules
740 selectors
757 declarations
730 unique declarations
0 media queries
11 unique colors
32 unique background colors
15 unique font sizes
7 unique z-indices
https://t.co/w7oNG5KUkJ
The legacy site's CSS is what happens when hundreds of people directly write CSS over many years. Specificity wars, redundancy, a house of cards that can't be fixed. The result is extremely inefficient and error-prone styling that punishes users and developers.
The PWA's CSS is generated on-demand by a JS framework that manages styles and outputs "atomic CSS". The framework can enforce strict constraints and perform optimisations, which is why the CSS is so much smaller and safer. Style conflicts and unbounded CSS growth are avoided.
One of the most successful stock trader with special focus on cash stocks and who has a very creative mind to look out for opportunities in dark times
Covering one of the most unique set ups: Extended moves & Reversal plays
Time for a 🧵 to learn the above from @iManasArora
What qualifies for an extended move?
30-40% move in just 5-6 days is one example of extended move
How Manas used this info to book
Post that the plight of the
Example 2: Booking profits when the stock is extended from 10WMA
10WMA =
Another hack to identify extended move in a stock:
Too many green days!
Read
Covering one of the most unique set ups: Extended moves & Reversal plays
Time for a 🧵 to learn the above from @iManasArora
What qualifies for an extended move?
30-40% move in just 5-6 days is one example of extended move
How Manas used this info to book
The stock exploded & went up as much as 63% from my price.
— Manas Arora (@iManasArora) June 22, 2020
Closed my position entirely today!#BroTip pic.twitter.com/CRbQh3kvMM
Post that the plight of the
What an extended (away from averages) move looks like!!
— Manas Arora (@iManasArora) June 24, 2020
If you don't learn to sell into strength, be ready to give away the majority of your gains.#GLENMARK pic.twitter.com/5DsRTUaGO2
Example 2: Booking profits when the stock is extended from 10WMA
10WMA =
#HIKAL
— Manas Arora (@iManasArora) July 2, 2021
Closed remaining at 560
Reason: It is 40+% from 10wma. Super extended
Total revenue: 11R * 0.25 (size) = 2.75% on portfolio
Trade closed pic.twitter.com/YDDvhz8swT
Another hack to identify extended move in a stock:
Too many green days!
Read
When you see 15 green weeks in a row, that's the end of the move. *Extended*
— Manas Arora (@iManasArora) August 26, 2019
Simple price action analysis.#Seamecltd https://t.co/gR9xzgeb9K