A very quick intro:
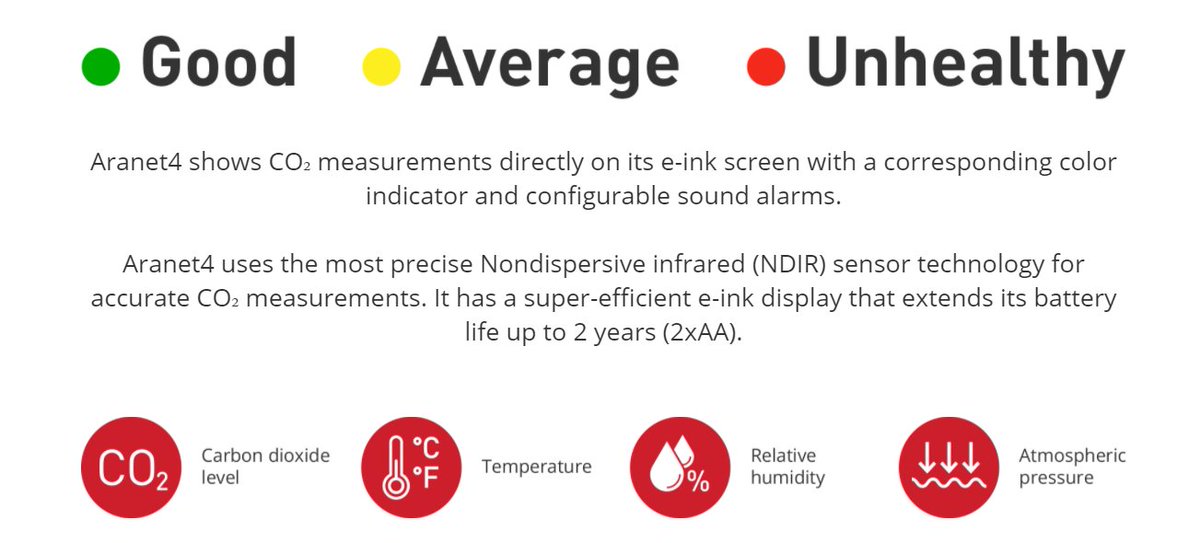
This device measures:
-CO2 concentration
-relative humidity
-atmospheric pressure
-temperature
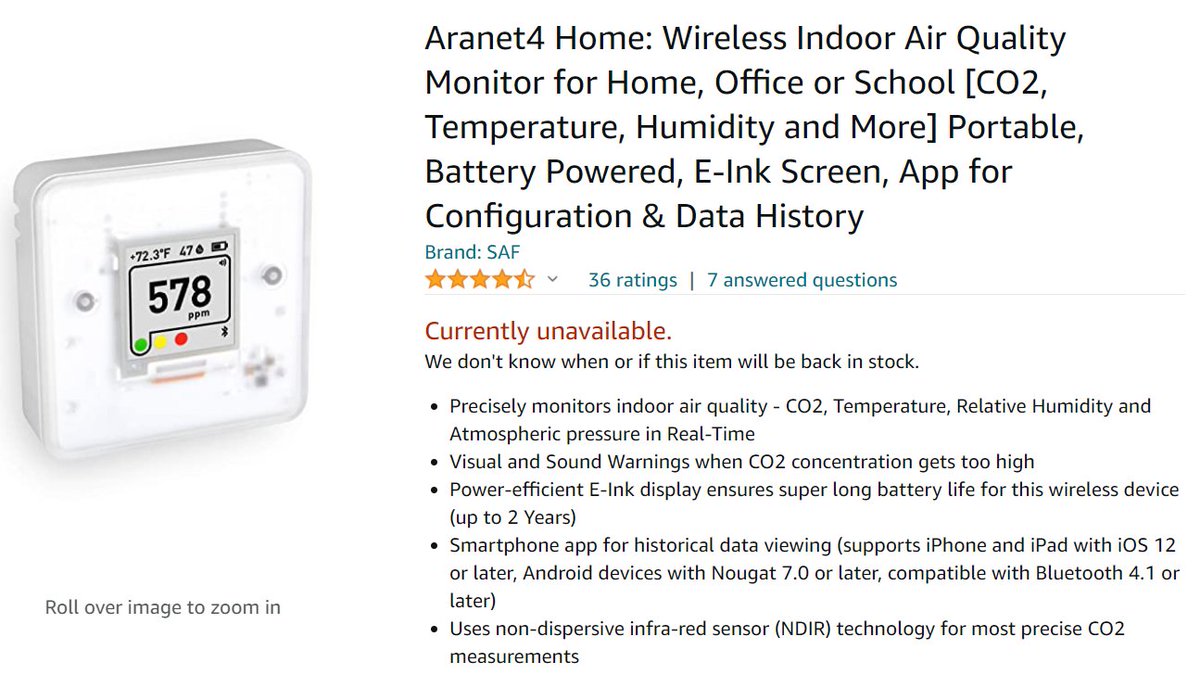
I spent ~$200 on Amazon. It pairs with your phone and you can watch data come in every minute or so.
https://t.co/aoXjyq8kdu
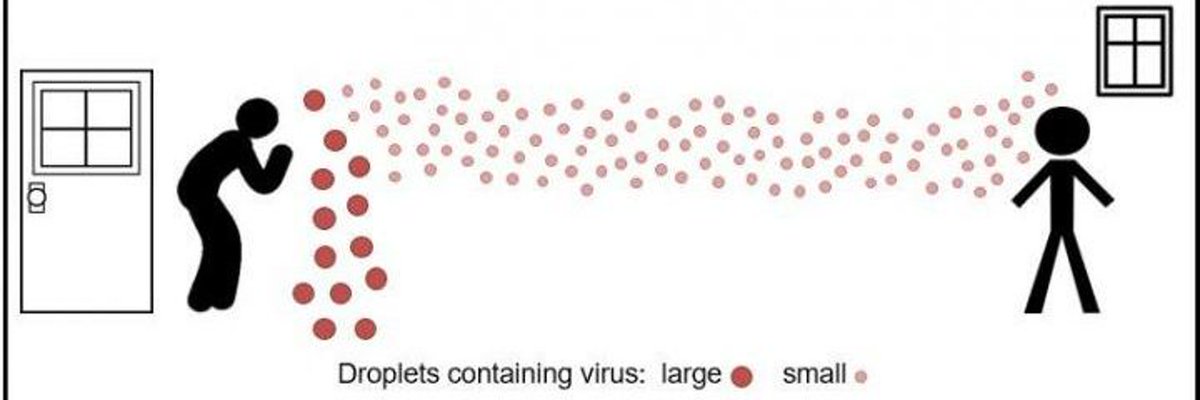
A lot of covid transmission is airborne. So, having clean air is a must for reducing transmission.
A great way to see how much clean air you are getting is to measure CO2 concentration.
Too high -> you could use more ventilation -> open some windows!
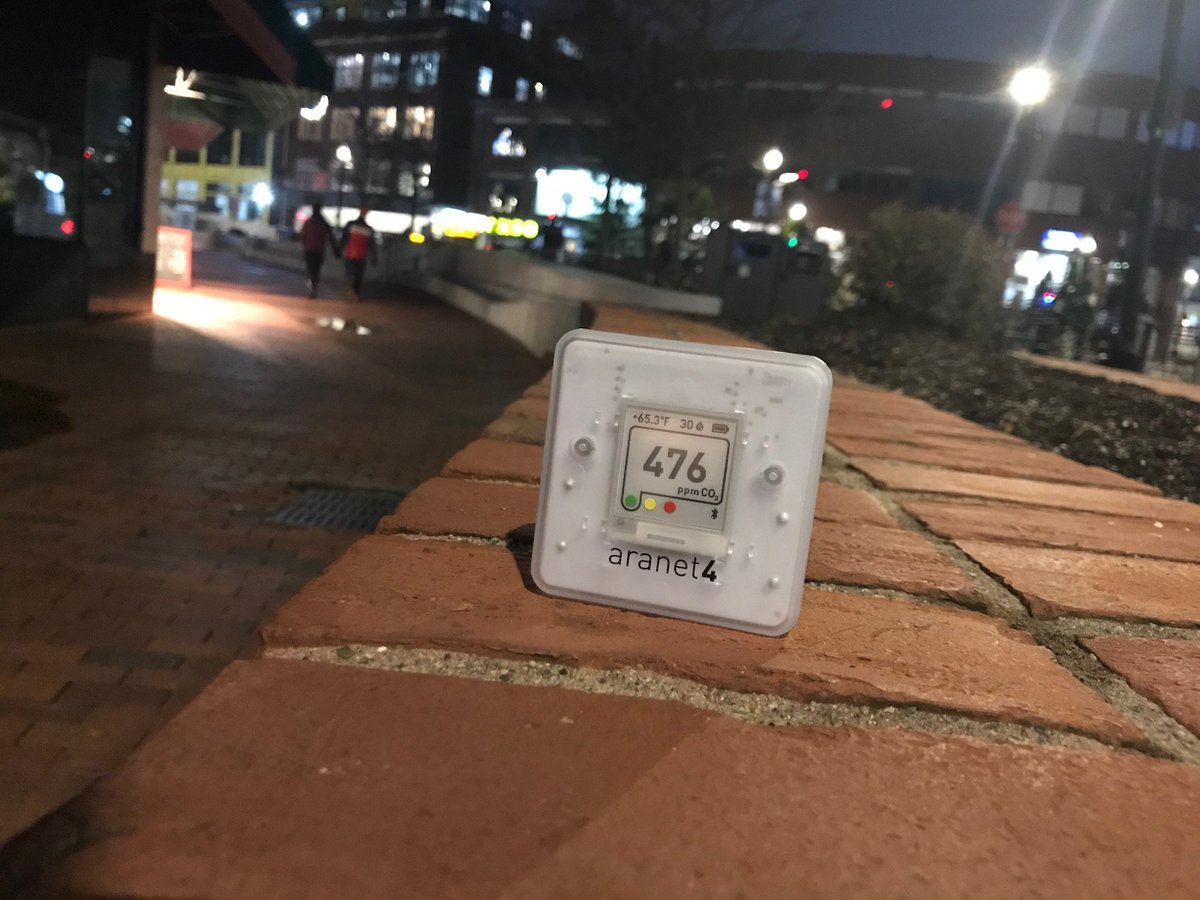
So, I walked around town and took some measurements.
Outdoor CO2 concentration should be about 400 ppm. I haven't calibrated my device yet, so I measured ~470. Close enough.
<800 is good for indoors. Something like 2000 is very bad.
https://t.co/oZAkVnr9ts
For a reference: inside my apartment I quickly get ~1000 ppm if I don't have windows open. Maybe ~1500 if things get bad.
If I crack some windows, even just barely, it gets down to ~600 ppm very quickly, and my heater can keep the apartment ~70 F no problem.
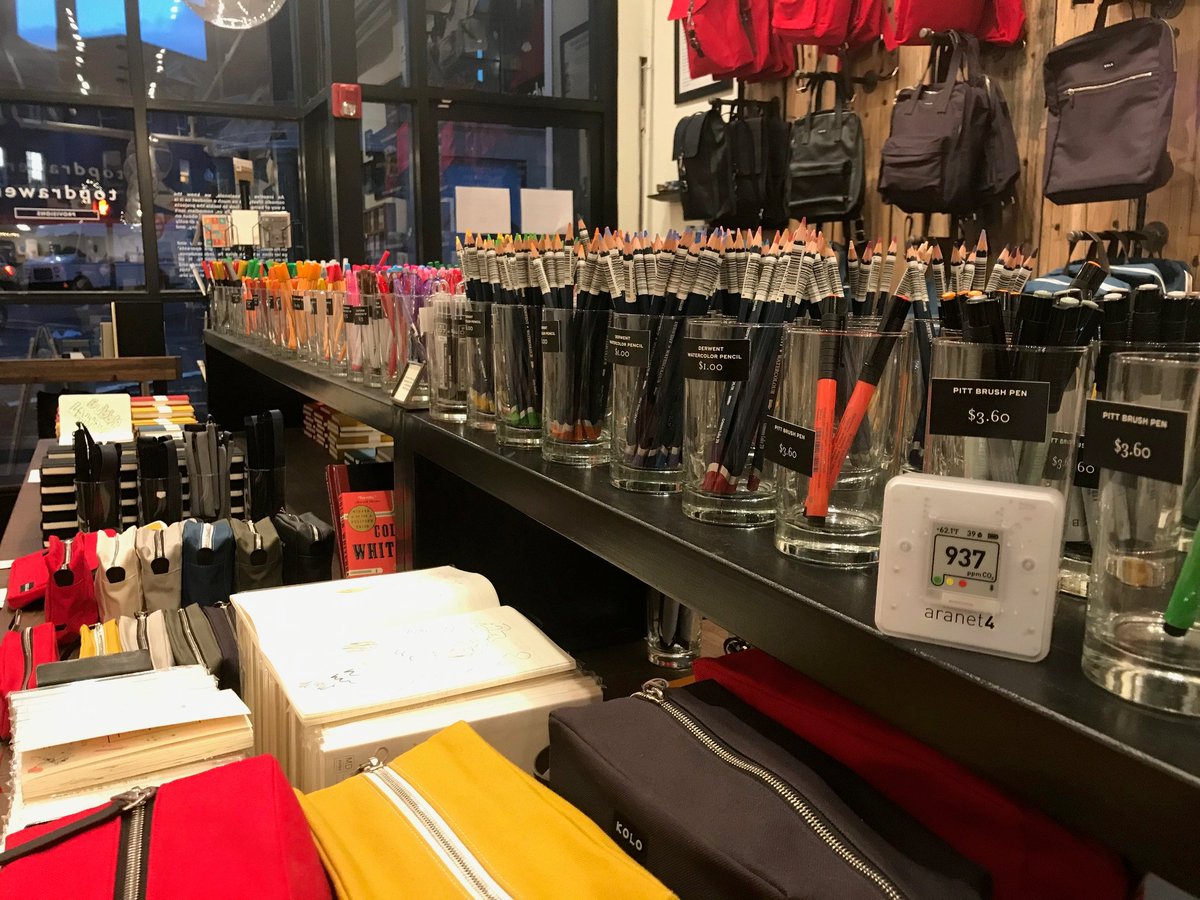
First stop: a small shop in Harvard Square. It is about 60 ft long, 20 ft wide, and usually has ~3 people in there.
CO2: 937 ppm.
Not great, not horrible. Surprisingly (to me), this place had the highest CO2 on my trip. It did have a purifier, which was nice.
Next stop: a very similar store, but it has less business and only ~1 person in there most of the time.
~700 ppm. Still good.
Plant shop around the corner, which was a bit larger in size, maybe 2-3x, but also maybe ~4 people in there on average.
650 ppm. Not bad!
Fun fact: this shop is 103 years old now.
Next stop was interesting: a paper store that was split into two completely separate rooms. Both the same size, and both had ~2 people in there. One had the AC blasting, the other had it off.
Basically the same results in both: 650-700 ppm
Next stop, a 2-floor CVS which is usually pretty busy. Picked a spot near the center of the store:
620 ppm. Still not bad!
The doors open often, and the AC was on.
Next stop was the Harvard bookstore.
560 ppm.
Very nice! Especially since my device reads ~470 outside.
Took this sample in the essential ideology section.
I was skeptical about the low values, so I went to another section (science books now).
520. Still good!
The whole store had their AC up very high. I could see many of the signs shaking due to airflow inside. I assume they were piping in outdoor air.
Overall, I was impressed with most places! I expected worse, but I also didn't go into any of the more dangerous areas, like restaurants (we still have indoor dining in Boston).
A side note: CO2 concentration is just a proxy for air quality. Not perfect, and many other things matter too.
Follow these people instead of me to get some real science:
@kprather88 @jljcolorado @ShellyMBoulder @CO2Guerrillas @jksmith34