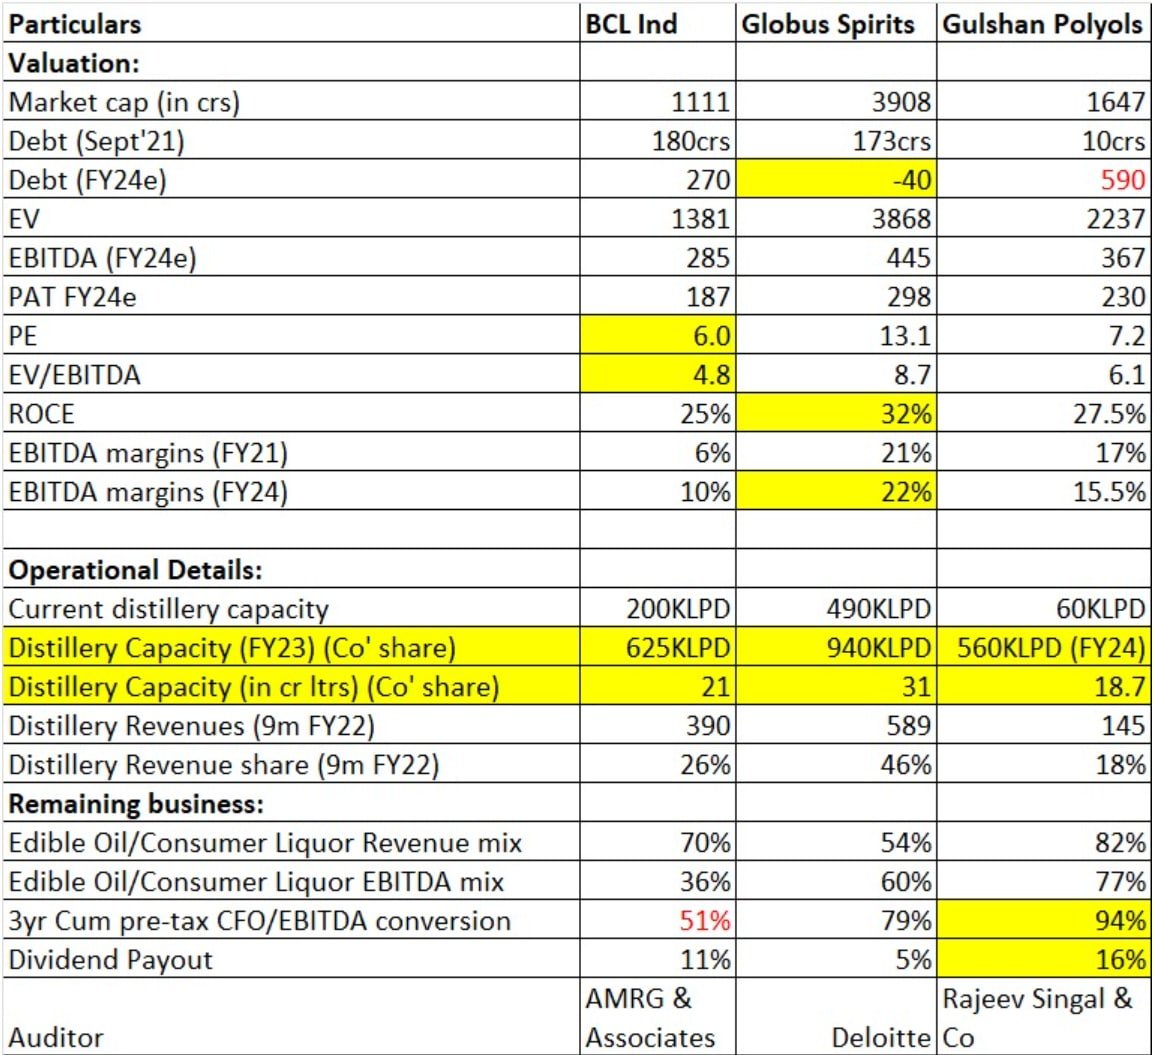
Comparison of non-sugar (grain/ rice) based ethanol players in India...JUST FYI....NO RECO
Thoughts welcome
#excelgiri
More from Varinder Bansal 🇮🇳


More from Sugar


You May Also Like


**Thread on Bravery of Sikhs**
(I am forced to do this due to continuous hounding of Sikh Extremists since yesterday)
Rani Jindan Kaur, wife of Maharaja Ranjit Singh had illegitimate relations with Lal Singh (PM of Ranjit Singh). Along with Lal Singh, she attacked Jammu, burnt - https://t.co/EfjAq59AyI

Hindu villages of Jasrota, caused rebellion in Jammu, attacked Kishtwar.
Ancestors of Raja Ranjit Singh, The Sansi Tribe used to give daughters as concubines to Jahangir.

The Ludhiana Political Agency (Later NW Fronties Prov) was formed by less than 4000 British soldiers who advanced from Delhi and reached Ludhiana, receiving submissions of all sikh chiefs along the way. The submission of the troops of Raja of Lahore (Ranjit Singh) at Ambala.
Dabistan a contemporary book on Sikh History tells us that Guru Hargobind broke Naina devi Idol Same source describes Guru Hargobind serving a eunuch
YarKhan. (ref was proudly shared by a sikh on twitter)
Gobind Singh followed Bahadur Shah to Deccan to fight for him.

In Zafarnama, Guru Gobind Singh states that the reason he was in conflict with the Hill Rajas was that while they were worshiping idols, while he was an idol-breaker.
And idiot Hindus place him along Maharana, Prithviraj and Shivaji as saviours of Dharma.

(I am forced to do this due to continuous hounding of Sikh Extremists since yesterday)
Rani Jindan Kaur, wife of Maharaja Ranjit Singh had illegitimate relations with Lal Singh (PM of Ranjit Singh). Along with Lal Singh, she attacked Jammu, burnt - https://t.co/EfjAq59AyI
Tomorrow again same thing happens bcoz fudus like you are creating a narrative oh Khalistan. when farmers are asking MSP. (RSS ki tatti khane wale Kerni sena ke kutte).
— Ancient Economist (@_stock_tips) December 5, 2020
U kill sikhs in 1984 just politics. To BC low IQ fudu Saale entire history was politics.
Hindu villages of Jasrota, caused rebellion in Jammu, attacked Kishtwar.
Ancestors of Raja Ranjit Singh, The Sansi Tribe used to give daughters as concubines to Jahangir.
The Ludhiana Political Agency (Later NW Fronties Prov) was formed by less than 4000 British soldiers who advanced from Delhi and reached Ludhiana, receiving submissions of all sikh chiefs along the way. The submission of the troops of Raja of Lahore (Ranjit Singh) at Ambala.
Dabistan a contemporary book on Sikh History tells us that Guru Hargobind broke Naina devi Idol Same source describes Guru Hargobind serving a eunuch
YarKhan. (ref was proudly shared by a sikh on twitter)
Gobind Singh followed Bahadur Shah to Deccan to fight for him.
In Zafarnama, Guru Gobind Singh states that the reason he was in conflict with the Hill Rajas was that while they were worshiping idols, while he was an idol-breaker.
And idiot Hindus place him along Maharana, Prithviraj and Shivaji as saviours of Dharma.