You may have noticed at the start of every book, there is a page which lists out various chapters and the page number for each chapter.
This is called the index of contents of the book.
It helps you understand what is where and give you a general idea how to read the book.
Similarly in the world of finance, we have financial indexes that are used to indicate where the overall market is trading.
Is it high or is it low?
Is it cheap or is it expensive?
These questions can be answered by looking at the index.
Fun Fact: The first ever financial index created was the Dow Jones Industrial Average in year 1896
The world created a financial index before cars, airplanes and electricity were the norm!
Stocks in 1896 used to look like this, an index was helpful to understand economy levels
If you want to read more about the history of stock market, you can go through this article
https://t.co/QRfJpURjDP
Now, back to topic of the day, indexes.
A financial index is made up of multiple stocks. These stocks are chosen based on the purpose of the index
There can be indexes for the entire economy like Dow Jones & Nifty 50 that have companies from all the various sectors or there can be indexes that track a specific sector.
Irrespective of what the index is made up of and which sector it tracks, the purpose for all indexes is the same.
They all track the overall sentiment and levels.
Without an index, we would have no idea which direction is overall market going at.
Index investing refers to investing in the index itself.
The idea is that since these indexes are a basket of stocks handpicked to represent either the economy or the sector in whole, one can buy every company in the index passively and still make money over time.
Index investing also lead to the rise of passive investing, which if done over time uninterrupted, can really generate decent returns.
But, beware! Not all indexes are the same.
When an index is created, the committee that creates the index has to decide weightage method of the index - how much weight or allocation should they give to the various companies in the index.
This weightage method can have drastic impact on your returns over the long term.
The three main popular types of weightage methods are
1. Market Cap Weighted
2. Free Float Market Cap Weighted
3. Price Weighted
There are multiple more types, which I won't dwell into. You can read all types at the below link.
https://t.co/wC9RmDY6Uu
Market Cap Weighted indexes use the market cap of their constituents to help decide the weightage.
Larger the market cap = Larger is the weightage
Smaller the market cap = Smaller is the weightage
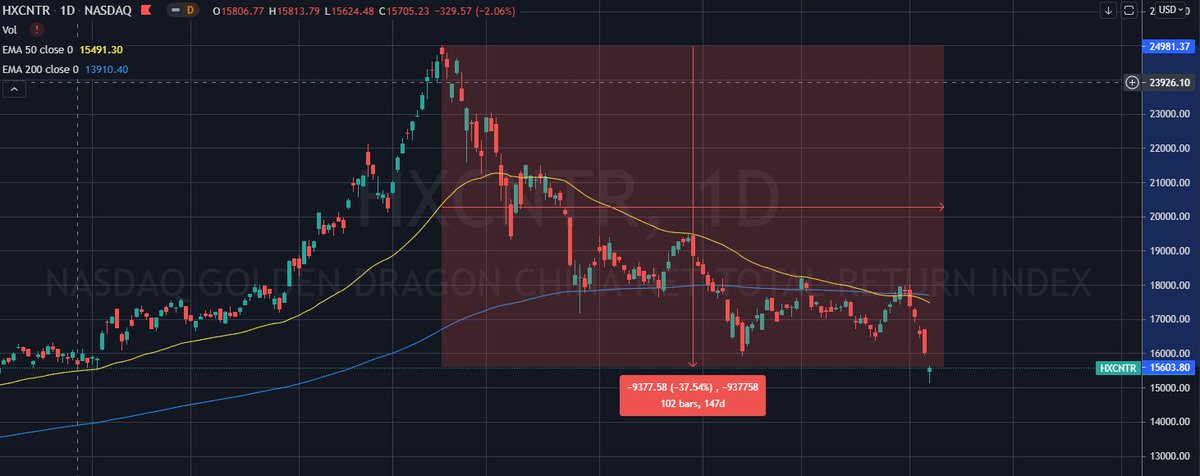
A good example of a market cap weighted index is the Nasdaq 100.
Why good?
Cause the index has rules and limits to how big the weightage can be for a single company in the index. This helps in making sure your investment is diversified enough within the basket of stocks.
These limits to weightage also help an investor allocate enough to companies that maybe aren't performing today but will in future and not allocate everything to companies that are the flavor of the season.
Also, unlike popular belief Nasdaq 100 is not just US Technology companies. It also includes BioTech and consumer stocks like Costco and media stocks like Fox and has companies incorporated in other parts of the world like Australia, Israel and Netherlands.
To me Nasdaq 100 is the definition of a good wholesome index. If you want me to do a detailed thread on Nasdaq 100, please leave a comment on this thread.
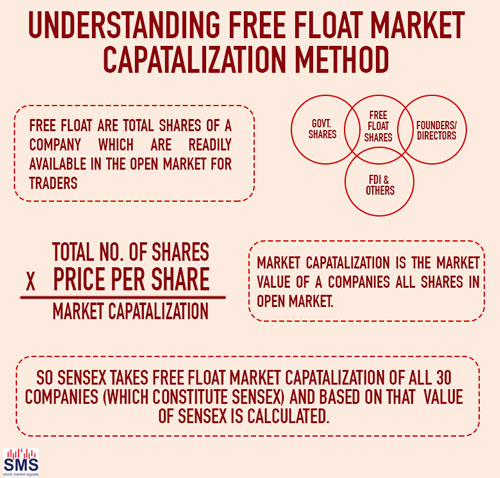
Coming to second Types of Indexes: Free Float Market Cap Weighted Index
The main difference between free float market cap and market cap indexes is that unlike market cap weighted indexes, free float indexes do not have an upper limit on the weightage for any one company.
This means, by investing in a free float market cap weighted index without an upper limit, you are essentially investing a lot in companies that are doing well and have large market caps than companies that maybe are doing well but do not have such a large market cap today.
To highlight this problem, here is the S&P 500 chart from mid 2018 when Tech companies were doing really well.
Just 5 companies out of 500 account for 50% of the entire index!
Here are some of the companies and their weightages in Nifty 50.
Same problem, larger market cap gets larger weightage.
Top 7 companies out of 50, account for 50% of the index.
The third Type of Market Weighting is called Price Weighted Market Cap Index.
In this type of index, price of a stock matters more in deciding the weightage of the stock rather than its market cap.
Weird logic, if you ask me!
The Dow Jones Index or DJI, is a prime example in this case.
The DJI, is a dinosaur and doesn't really matter anymore esp. if you're using it to judge the health of the economy. Because of its price weighted measure and only 30 stocks under it, there aren't many funds available that invest in the DJI.
The last part of this thread - How to make your own indexes!
Just like market indexes help you judge the level of the economy, you have sector specific indexes that help you judge health of that sector.
Nifty has one for small caps, midcaps, healthcare, financials, you name it!
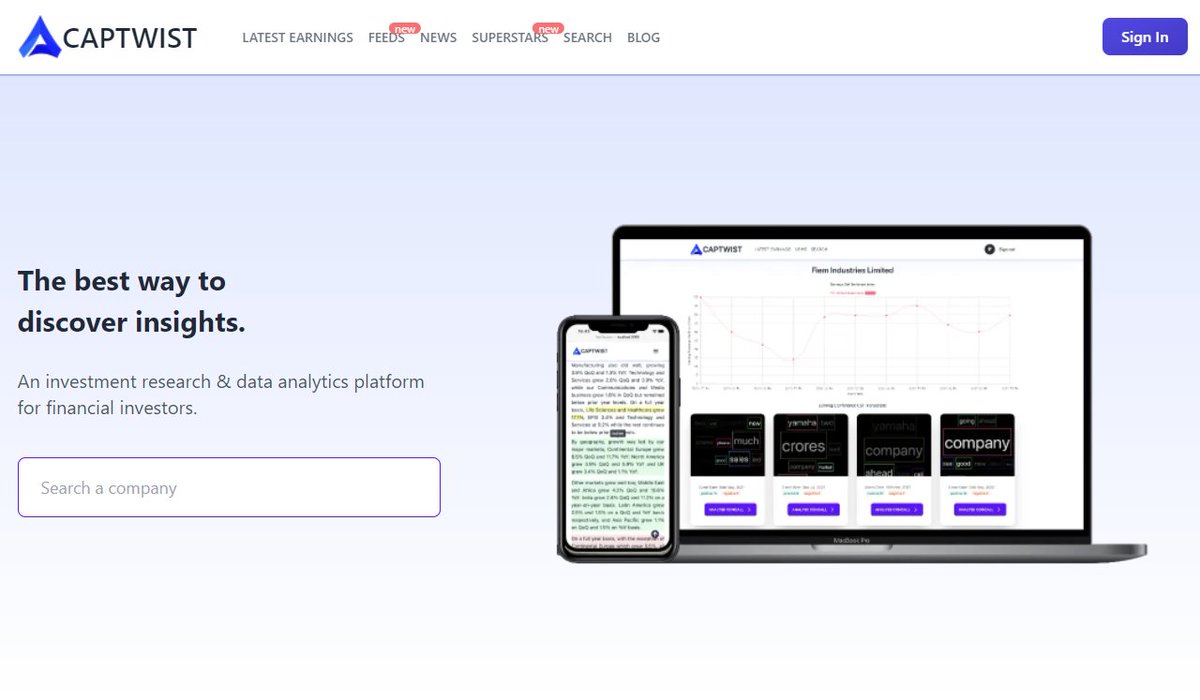
But sometimes, a readily available index may not be available to you. Lets say for renewables or for specialty chemicals. This is where you can create your own indexes with tools like TradingView.
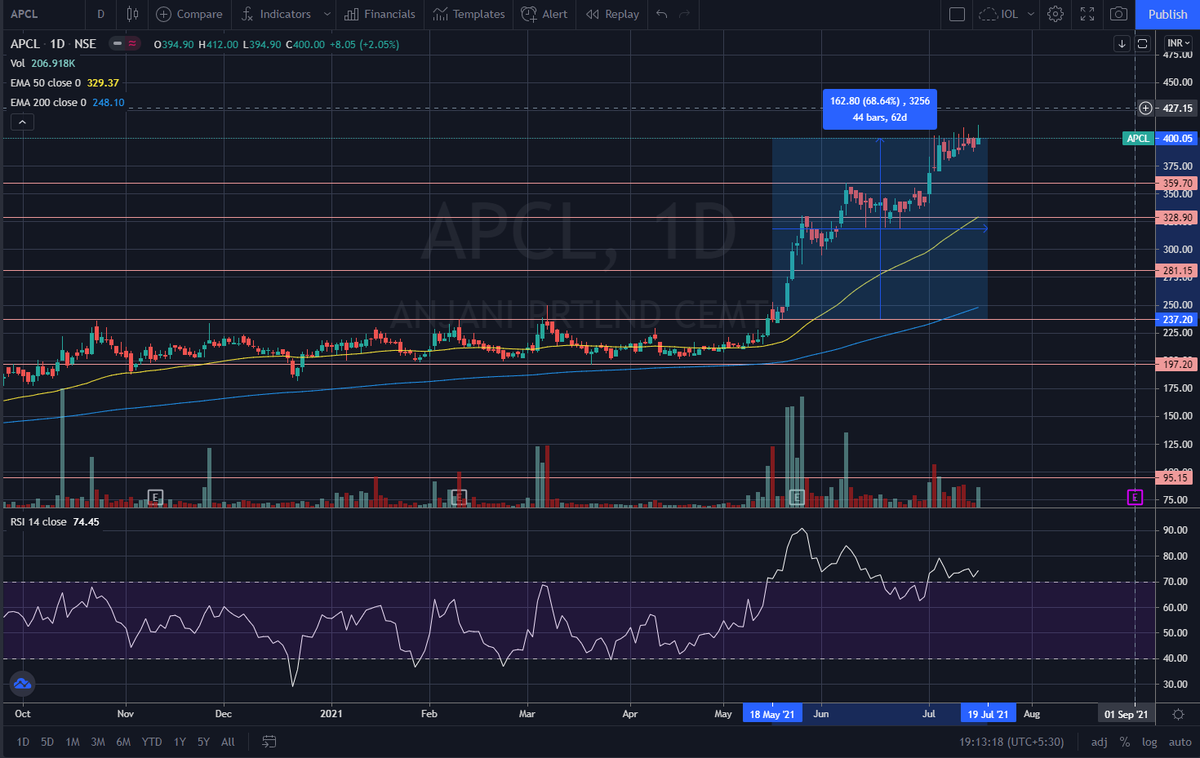
Here is one I created for Specialty Chemical companies like Vinati, Navin, Deepak and Aarti (why do all these companies have names of a person) and compared their performance with Nifty 50 since Jan 2020.
Here is one for Renewable related stocks like Borosil Renewables, IEX and Praj, compared to the performance of Nifty 50 since Jan 2020.
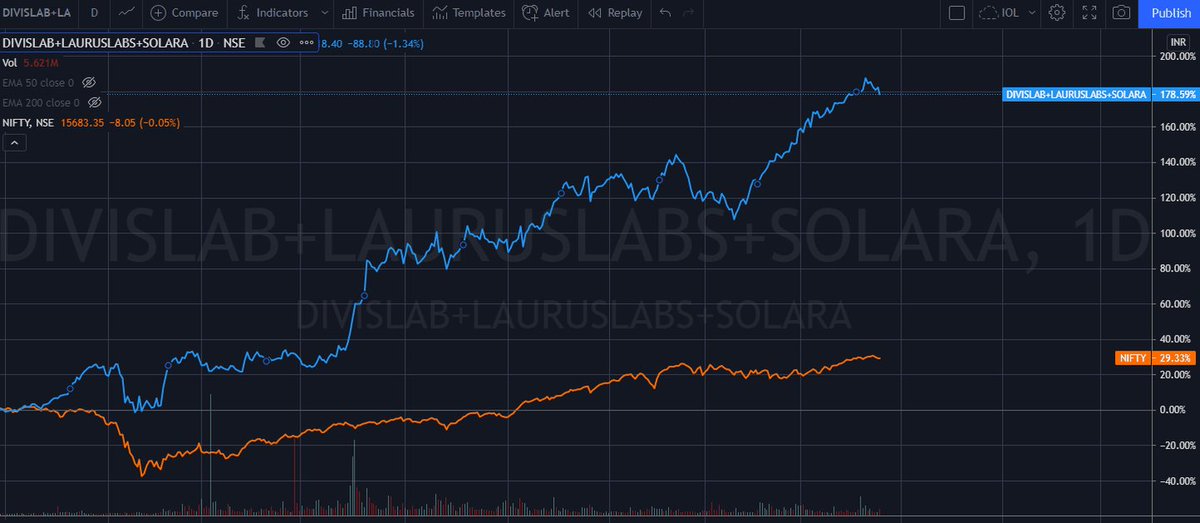
Here is one for API companies like Divis, Laurus and Solara, compared to the performance of Nifty 50 since Jan 2020.
Here is a gif with instructions on how to make these indexes for yourself.
With this, we come to an end of this thread.
I hope this thread helped you understand indexes better.
If you find this thread useful then follow me
@itsTarH I write a new thread every weekend.
All my previous work, can be found here.
https://t.co/az1Rsw05TO Please also retweet
I also teach a class on data visualization, if you're interested. The kind folks at Skillshare have increased the free trial length to 30 days if you sign up using this link
https://t.co/VyPiV7u7pp The class itself is 1.5 hours long so 30 days will give you enough time to learn.
Sometimes write long form articles, researching into various industries, companies and concepts in personal finance here.
Subscribe for free, if you're interested.
Thank you for the 1000 of you who already have!
https://t.co/6tHU5fQXGu
This community has grown beyond my expectations, so thank you for all the support!
Will continue to write threads and help spread the knowledge :)
See you next weekend!