In such a case, H&S can be either a continuation pattern or compound fulcrum.
This is how to differentiate:
• if right shoulder is smaller than left, most likely a continuation H&S
• if right is same or higher than left, and the price is not coming to neckline, most likely CF
sir a doubt does head & shoulders work in down trend ? pic.twitter.com/dytYmbzOfp
— Vega_Greek (@VegaGreek) May 13, 2021
More from Piyush Chaudhry

More from Stockslearnings


#Freetip
Today's move is an example of this tweet. Save this chart for future ref. https://t.co/amUhSLrET3
Today's move is an example of this tweet. Save this chart for future ref. https://t.co/amUhSLrET3
#FreeTip
— HMK alias MANOJ (@scorpiomanojFRM) June 23, 2021
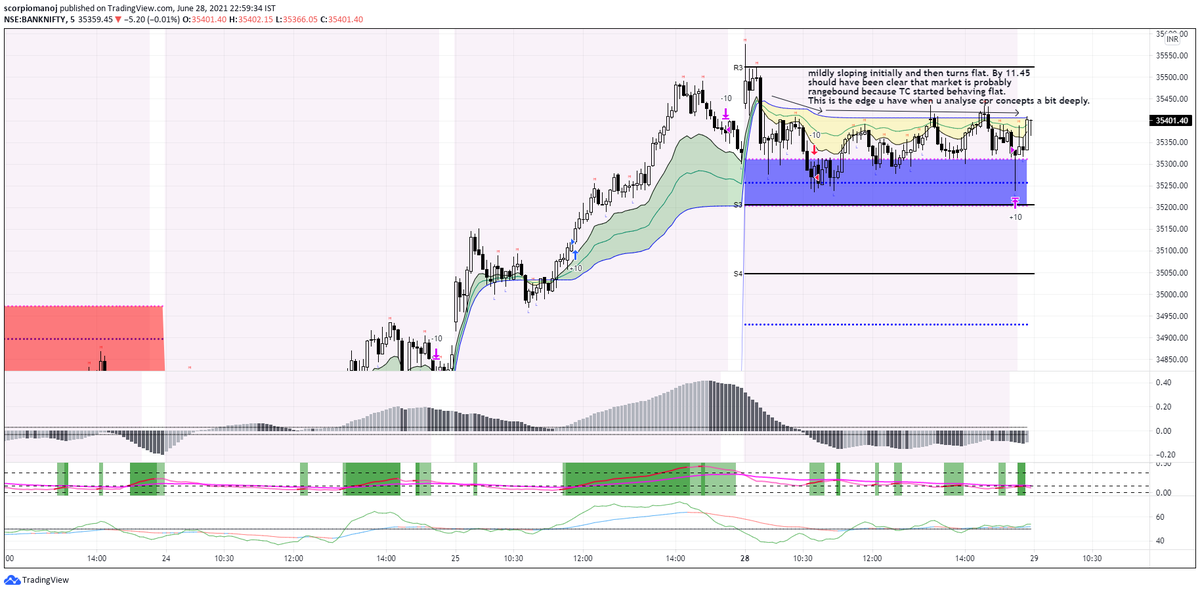
A general rule to assess if a market is ranging is to look at developing TC and / or developing BC. If either of them is flat, it means market is currently ranging. If you are trading in 5 min, go to a lower tf chart, say, 2 min to have a less lagging assessment.


This is so useful. Thank you @heartwon 🙏
On this auspicious day of #GuruPoornima2020
— \u03b1\u043c\u03b9\u0442\u0442 \u0455\u03b1\u03b9\u03b7\u03b9 \U0001f1ee\U0001f1f3 (@heartwon) July 5, 2020
Would like to present a simple yet effective way of understanding and following the TREND of the instrument/stock.
Q: Why I came up with the concept?
A: I wanted to remove noise, keep my chart simple where just a glance, tells the story