
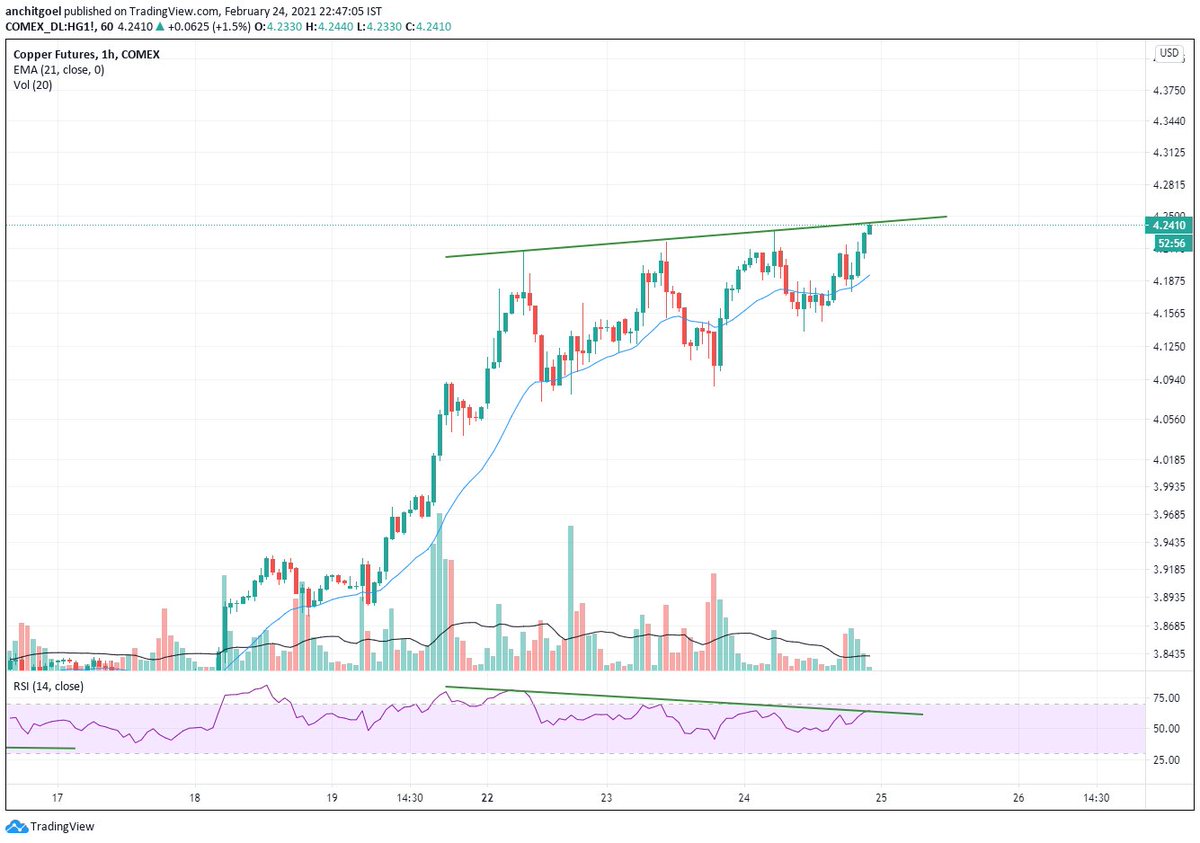
#HindCopper
10% more gains to 127.75 !! 🍻🔥🚀
Expecting it to consolidate now in coming days before a final move to 145-150 levels. #Copper RSI is overheated and needs to cool down.
Negative divergence building up on hourly charts. https://t.co/sBU4O6QZsq
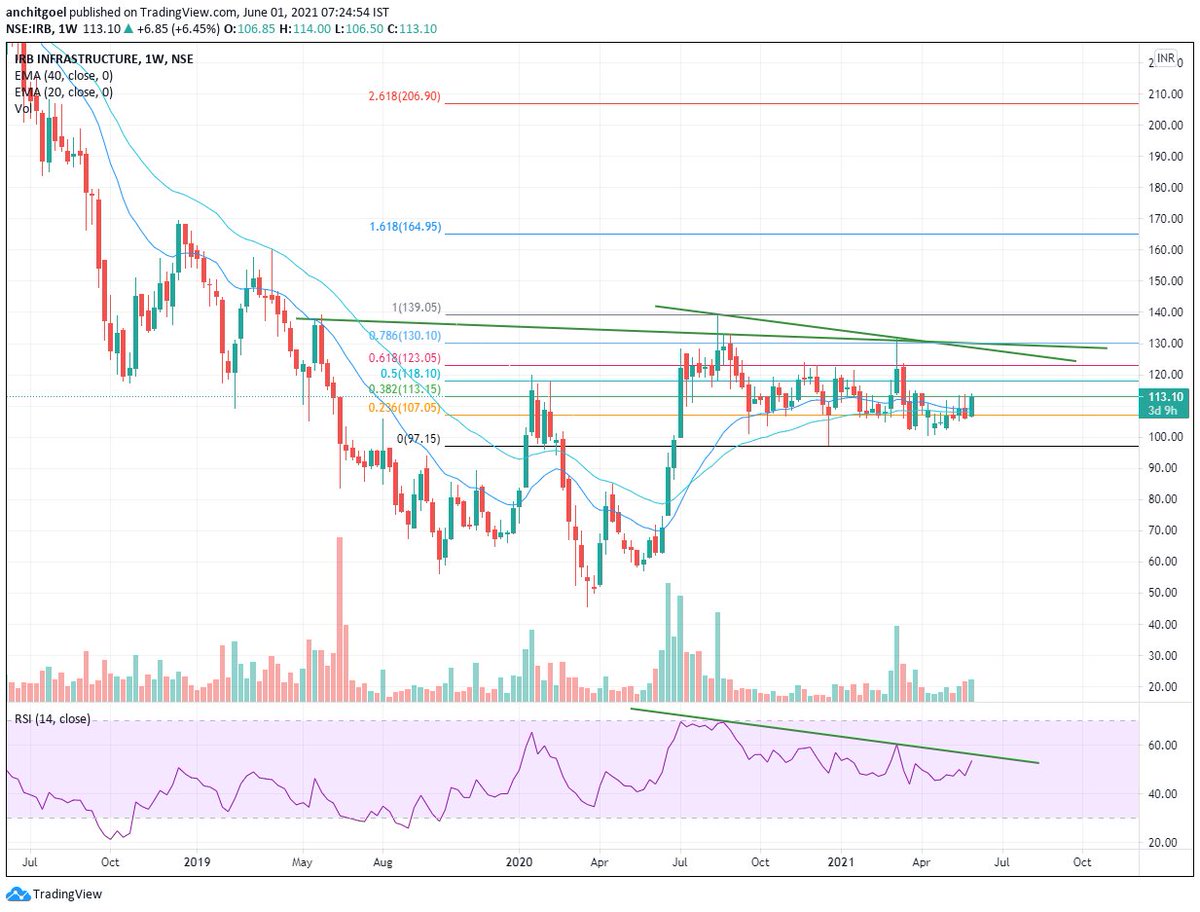
#HindCopper
— Anchit Goel (@anchitsays) February 23, 2021
20% Upper Circuit at 118.05 now!! \U0001f389\U0001fa85\U0001f525\U0001f680\U0001f973\U0001f37b\U0001f60d
Conviction and patience has given excellent results. https://t.co/T5y2CBY9Lt pic.twitter.com/xvDeR91PkL
More from Anchit Goel
On this auspicious day of #GuruPoornima2020
— \u03b1\u043c\u03b9\u0442\u0442 \u0455\u03b1\u03b9\u03b7\u03b9 \U0001f1ee\U0001f1f3 (@heartwon) July 5, 2020
Would like to present a simple yet effective way of understanding and following the TREND of the instrument/stock.
Q: Why I came up with the concept?
A: I wanted to remove noise, keep my chart simple where just a glance, tells the story


More from Stockslearnings


• Lessons learned from Trading Mistakes
• Moneycontrol article on a pro option seller
• Rakesh Jhunjhunwala investing strategy.
• What do you really need?
• Stocks to invest for long term
A thread 🧵
Best Trading books to read - check the comments section for some great
What's the best trading book you've ever read?
— Steve Burns (@SJosephBurns) September 30, 2021
Lessons learned from some trading
Trading Mistakes & Lessons Learnt \U0001f9f5
— Sourabh Sisodiya, CFA (@sourabhsiso19) September 30, 2021
1) I always keep my mistakes & lessons learnt in front of my screen while trading.
Bcz we as traders tend to commit the same mistakes everytime.
So seeing your learnt lessons everyday ensures that you avoid them.
#trading #mistakes pic.twitter.com/4MYFlCS9Hi
In spite of being rejected in many things, we can still be
I had been rejected many times in my life few are:
— ASAN (@Atulsingh_asan) September 30, 2021
-I was Rejected in a BPO job interview 2006
-I was Rejected in Indian Idol 2011
But Market accepted me as a student since 2013 and journey on
Don\u2019t lose hope when you rejected by someone, keep trying you will succeed.#ASAN
Moneycontrol article on @Pathik_Trader to learn how to trade breakouts with good risk management & position
Small article on my trading journey covered by Shishir in moneycontrol. Thanks a lot shishir.\U0001f942\U0001f942
— Pathik (@Pathik_Trader) September 27, 2021
It's kind of dream come true moment. \U0001f60d\U0001f942
Thank you everyone for inspiration & support. Special thanks to @sanstocktrader@Stockengg @VRtrendfollower\U0001f942\U0001f942https://t.co/0fk2gpd1qv

You May Also Like


make products.
"If only someone would tell me how I can get a startup to notice me."
Make Products.
"I guess it's impossible and I'll never break into the industry."
MAKE PRODUCTS.
Courtesy of @edbrisson's wonderful thread on breaking into comics – https://t.co/TgNblNSCBj – here is why the same applies to Product Management, too.
"I really want to break into comics"
— Ed Brisson (@edbrisson) December 4, 2018
make comics.
"If only someone would tell me how I can get an editor to notice me."
Make Comics.
"I guess it's impossible and I'll never break into the industry."
MAKE COMICS.
There is no better way of learning the craft of product, or proving your potential to employers, than just doing it.
You do not need anybody's permission. We don't have diplomas, nor doctorates. We can barely agree on a single standard of what a Product Manager is supposed to do.
But – there is at least one blindingly obvious industry consensus – a Product Manager makes Products.
And they don't need to be kept at the exact right temperature, given endless resource, or carefully protected in order to do this.
They find their own way.
