In his recent article, @cjsnowdon claims that England's November lockdown was a good example of lockdown effectiveness. Let’s look at that claim using the ONS death-by-date registration data which have now been updated for the relevant period.
So what actually happened?
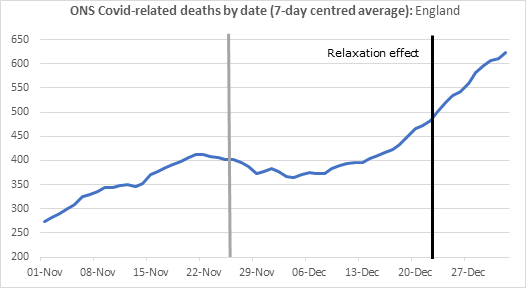
Deaths increase again from 4 Dec implying infections increased right in the middle of the national lockdown.
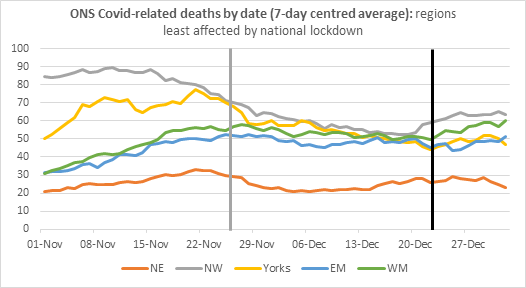
Also, as these areas largely returned to lower tiers on 2 Dec, relaxation shd have a bigger adverse effect than in North/Mids.
What do we see?
Similarly no clear, consistent effect after LD2 lifted.
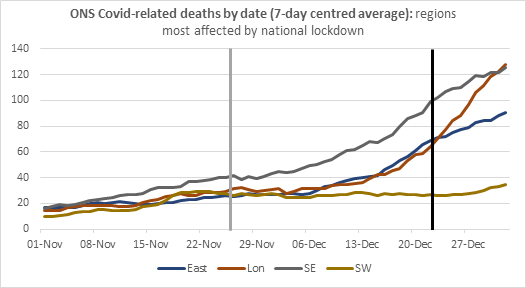
Poss SE & L stabilised a little after LD but briefly. No consistent effect on trends from Dec relaxation: perhaps L accelerates a bit, but E slows down. SW little affected by either.
More from Society


I've seen many news articles cite that "the UK variant could be the dominant strain by March". This is emphasized by @CDCDirector.
While this will likely to be the case, this should not be an automatic cause for concern. Cases could still remain contained.
Here's how: 🧵
One of @CDCgov's own models has tracked the true decline in cases quite accurately thus far.
Their projection shows that the B.1.1.7 variant will become the dominant variant in March. But interestingly... there's no fourth wave. Cases simply level out:
https://t.co/tDce0MwO61
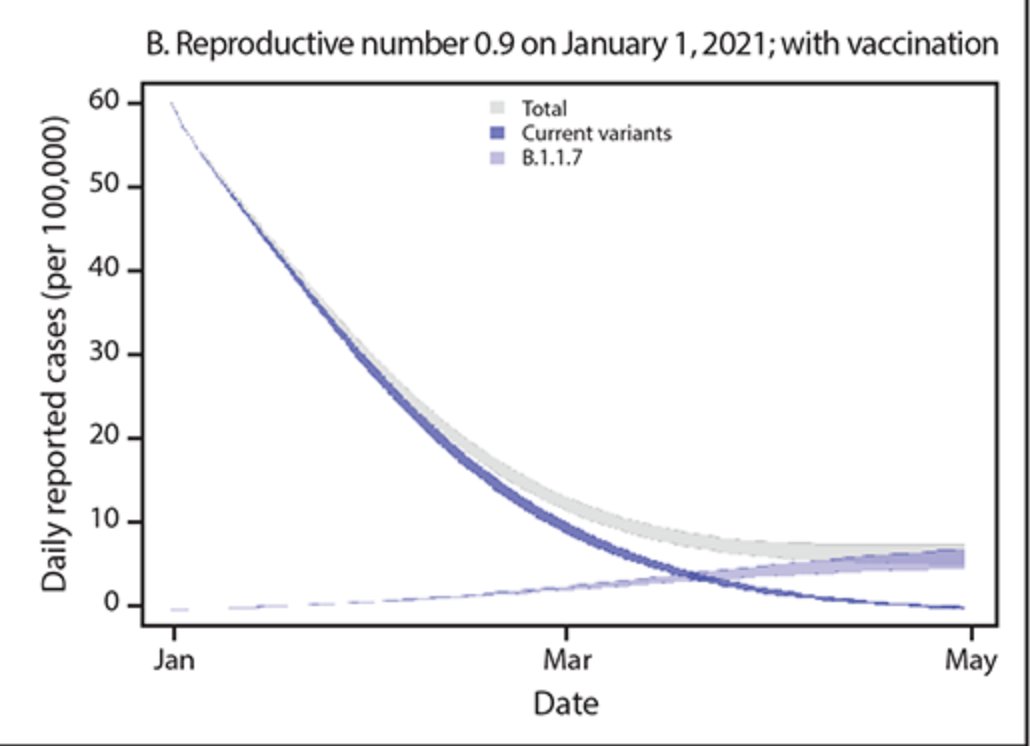
Just because a variant becomes the dominant strain does not automatically mean we will see a repeat of Fall 2020.
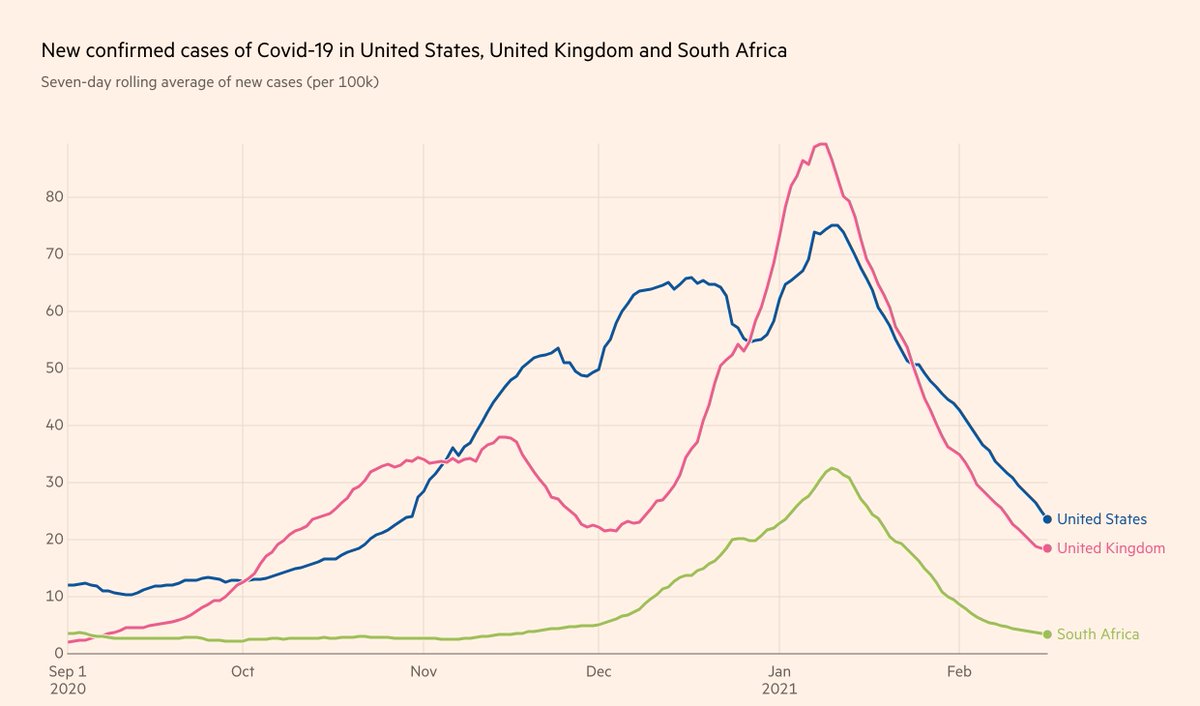
Let's look at UK and South Africa, where cases have been falling for the past month, in unison with the US (albeit with tougher restrictions):
Furthermore, the claim that the "variant is doubling every 10 days" is false. It's the *proportion of the variant* that is doubling every 10 days.
If overall prevalence drops during the studied time period, the true doubling time of the variant is actually much longer 10 days.
Simple example:
Day 0: 10 variant / 100 cases -> 10% variant
Day 10: 15 variant / 75 cases -> 20% variant
Day 20: 20 variant / 50 cases -> 40% variant
1) Proportion of variant doubles every 10 days
2) Doubling time of variant is actually 20 days
3) Total cases still drop by 50%
While this will likely to be the case, this should not be an automatic cause for concern. Cases could still remain contained.
Here's how: 🧵
One of @CDCgov's own models has tracked the true decline in cases quite accurately thus far.
Their projection shows that the B.1.1.7 variant will become the dominant variant in March. But interestingly... there's no fourth wave. Cases simply level out:
https://t.co/tDce0MwO61
Just because a variant becomes the dominant strain does not automatically mean we will see a repeat of Fall 2020.
Let's look at UK and South Africa, where cases have been falling for the past month, in unison with the US (albeit with tougher restrictions):
Furthermore, the claim that the "variant is doubling every 10 days" is false. It's the *proportion of the variant* that is doubling every 10 days.
If overall prevalence drops during the studied time period, the true doubling time of the variant is actually much longer 10 days.
Simple example:
Day 0: 10 variant / 100 cases -> 10% variant
Day 10: 15 variant / 75 cases -> 20% variant
Day 20: 20 variant / 50 cases -> 40% variant
1) Proportion of variant doubles every 10 days
2) Doubling time of variant is actually 20 days
3) Total cases still drop by 50%