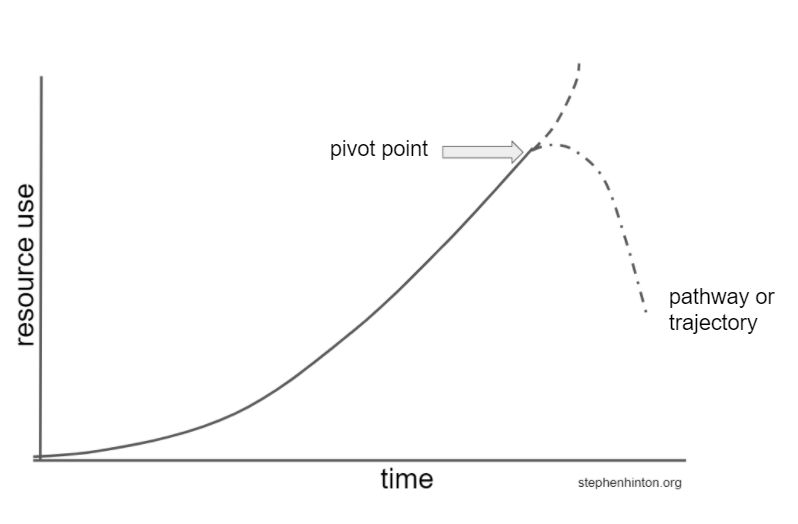
THREAD: one more time on the need for citizens to understand the need for, then demand, then deliberate on, then manage - a total pivotal change. Next tweet..what is a pivot and why we need one 1/
Ancient Rome
Mayan Civilisation
Ancestral Puebloans
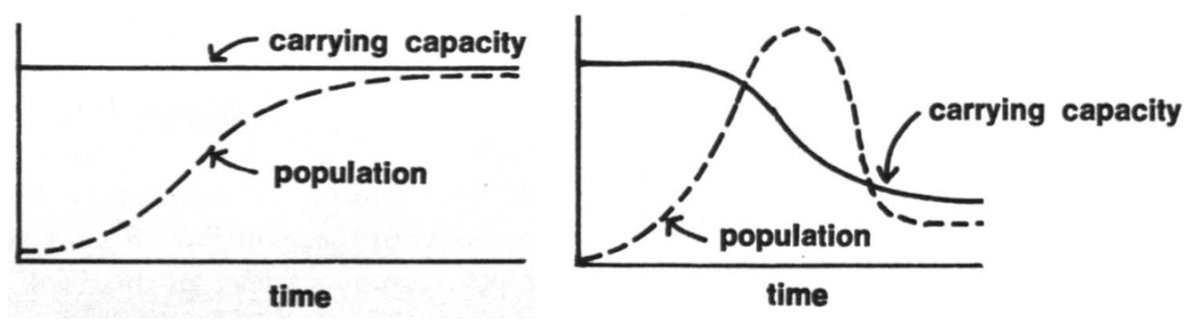
Modern society is exhibiting all the signs (Club of Rome 1972) 4/
https://t.co/ND85PXV9MB

More from Society


global health policy in 2020 has centered around NPI's (non-pharmaceutical interventions) like distancing, masks, school closures
these have been sold as a way to stop infection as though this were science.
this was never true and that fact was known and knowable.
let's look.
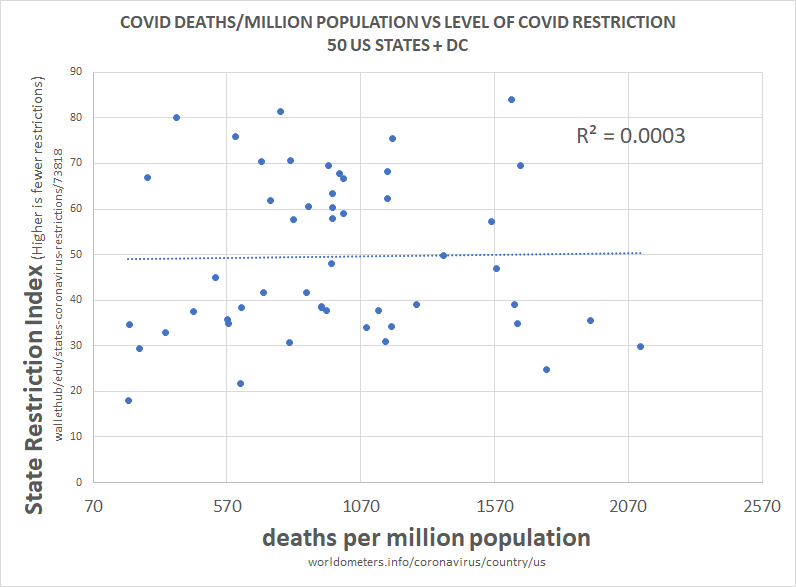
above is the plot of social restriction and NPI vs total death per million. there is 0 R2. this means that the variables play no role in explaining one another.
we can see this same relationship between NPI and all cause deaths.
this is devastating to the case for NPI.
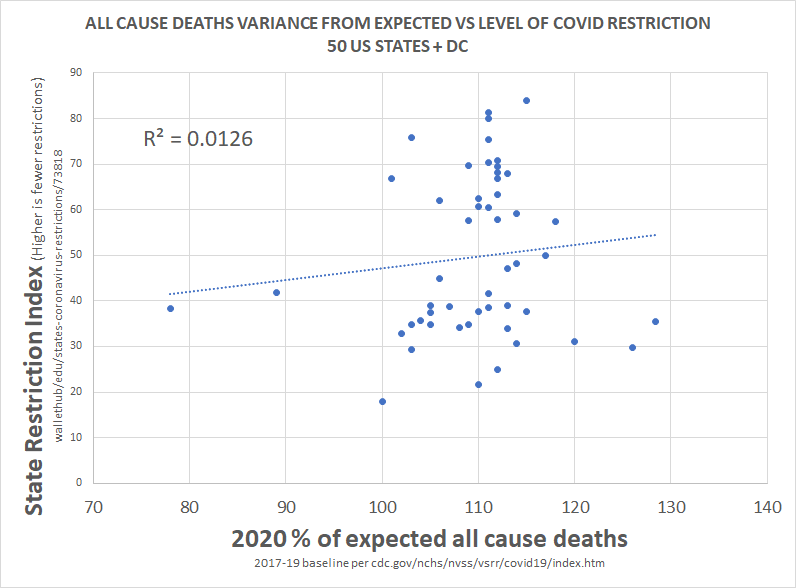
clearly, correlation is not proof of causality, but a total lack of correlation IS proof that there was no material causality.
barring massive and implausible coincidence, it's essentially impossible to cause something and not correlate to it, especially 51 times.
this would seem to pose some very serious questions for those claiming that lockdowns work, those basing policy upon them, and those claiming this is the side of science.
there is no science here nor any data. this is the febrile imaginings of discredited modelers.
this has been clear and obvious from all over the world since the beginning and had been proven so clearly by may that it's hard to imagine anyone who is actually conversant with the data still believing in these responses.
everyone got the same R
these have been sold as a way to stop infection as though this were science.
this was never true and that fact was known and knowable.
let's look.
above is the plot of social restriction and NPI vs total death per million. there is 0 R2. this means that the variables play no role in explaining one another.
we can see this same relationship between NPI and all cause deaths.
this is devastating to the case for NPI.
clearly, correlation is not proof of causality, but a total lack of correlation IS proof that there was no material causality.
barring massive and implausible coincidence, it's essentially impossible to cause something and not correlate to it, especially 51 times.
this would seem to pose some very serious questions for those claiming that lockdowns work, those basing policy upon them, and those claiming this is the side of science.
there is no science here nor any data. this is the febrile imaginings of discredited modelers.
this has been clear and obvious from all over the world since the beginning and had been proven so clearly by may that it's hard to imagine anyone who is actually conversant with the data still believing in these responses.
everyone got the same R
this methodology is a little complex, so let me explain what i did.
— el gato malo (@boriquagato) May 30, 2020
a few EU countries provide real day of death data. this lets us plot meaningful curves to show rate of disease change.
what struck me is how similar all the curves were.
everyone got the same shape. pic.twitter.com/bN0hILzoSl