2/14
Usually people will use all their knowledge to make guesstimates about an investment like:
- 20% chance to go bust
- 20% chance to break-even
- 40% chance to double
- 10% chance to 4x
- 10% chance to 10x
And then state "for me, this is good from a risk/reward standpoint".
3/14
That last statement will be different for each individual though. For some people the investment laid out above may be great from a risk/reward standpoint, because of the high expected ROI. For others, it may be terrible because of the 20% chance to go bust.
4/14
Investing is much more complex than just making money and maximizing returns, and investment strategies should differ from individual to individual. If this is news to you, I strongly suggest you read through the first section of this blog post:
https://t.co/CZ17h4OvAl
5/14
The final section of the same blog post goes into depth on $TSLA call options, and how I go about evaluating them. There is even a subsection called "The Risk Reward of Call Options" that should answer a lot of your questions.
6/14
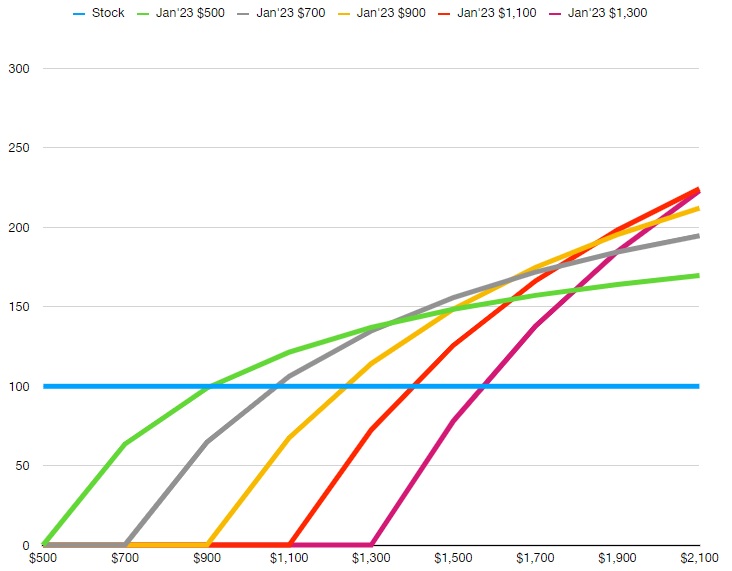
Evaluating the risk/reward of Jan'23 call options today in a similar way, gets us the following graph. Just to break-even on a $1,300 Jan'23 call compared to holding stock, the SP would have to go to ~$1,600.
7/14
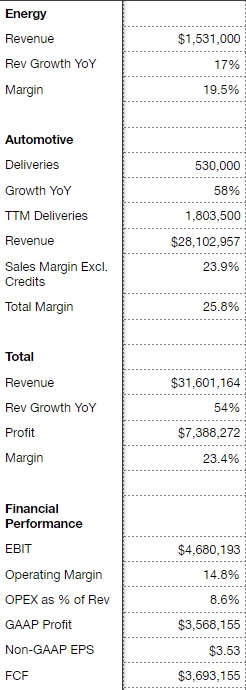
As for what the SP might be at at the end of 2022, take a look at this. I haven't looked at these numbers in depth for a while, but just as an example, off of ~500k deliv, ~25% margin, and ~15% op margin, we could see ~$4.5B in EBIT, which would be a $18B yearly run-rate.
8/14
I used 50x EBIT as a valuation metric in the past when evaluating options, which in my opinion is safe-ish for $TSLA for the foreseeable future. Using 50x extrapolated EBIT would put $TSLA at $900B and a SP of ~$950, given the numbers above.
9/14
Even using 80x extrapolated EBIT, which is well above AMZN's 65x extrapolated EBIT, $TSLA would still only be $1.44T, and SP would be ~$1,500, meaning most of the Jan'23 options would only marginally outperform $TSLA common stock.
10/14
When you take into account all the risks, such as Biden changing corporate tax rates, the FED increasing the interest rate, Tesla not achieving 500k deliv per quarter by the end of 2022, the market simply valuing $TSLA at less than 80x EBIT, etc.
11/14
I don't believe Jan'23s are good at all from a risk/reward standpoint. It also ups one's stress levels, and requires a lot more time involvement. You can simply hold stock long-term, but you need to stay 100% up to date on everything when holding options.
12/14
Last but certainly not least, putting money into $TSLA options today carries with it high opportunity cost imo. Holding stock means you can take advantage of unforeseen dips by leveraging up into options, which is not possible when you're already highly leveraged.
13/14
Therefore, I caution against investing too heavily in $TSLA options today. ATM and ITM leaps are likely slightly profitable, but OTM leaps are risky for relatively low reward. Even at $2,100, Jan'23 $1,300s would only net 2.25x vs holding stock.
14/14
$TSLA is the best investment I know off for the next 10 years, which is why 100% of my portfolio is still in $TSLA common stock, but it's pretty safe to say it'll never experience another 10x year like 2020.