Diminishing Marginal Returns

The productivity of our debt is collapsing and that is creating a major problem.

The problem is here now, and not in the future.

Here is why:

1)

Charted below is the increase in total debt and the increase in nominal GDP in the 8 quarters before each of the last six recessions.

In other words, how much did debt increase, and how much did GDP increase in the final two years of each economic expansion?

2)
As the chart shows, it is taking a larger amount of debt to increase GDP.

3)
Graphed another way, leading up to the 1980 recession it took about 1.94 dollars of debt to boost GDP by 1 dollar.

Leading up to the COVID recession saw debt increase nearly 6 dollars for each 1 dollar of GDP growth.

4)
Flipping the ratio shows the decline in the utility of debt.

We are only generating about 15-20 cents of growth for each dollar of debt.

This becomes a larger problem when we think about "growth rates" instead of nominal dollars.

5)
Before the 2007 recession, it took about $9T of debt to increase GDP by $1.3T. Or, it took about $9T of debt to increase nominal GDP by 4.9%/year in those two years.

The same $1.3T increase in nGDP only translated to a 3.2% growth rate per year leading up to 2020.

6)
In other words, $9T of debt got us ~5% nominal growth in 2005-2007 and only ~3% in 2018-2020.

The problem is here now because we know it will take about $10T of new debt to increase GDP by $1.5T.

That would only be an increase in growth of 3% nominal per year.

7)
As we continue to press down on this diminishing marginal returns curve, we will find ourselves using 8-10 units of debt for each dollar of growth, each dollar that generates a lower "growth rate" on a higher base.

8)
With any political division, Congress will not be able to authorize the spending needed to increase GDP by the same ~3% per year as the numbers are simply getting too large.

$10T in total debt growth won't even get us 3% nominal.

9)
If we have just 2% inflation then $10T in new debt will only lead to about 1% real growth.

At this stage of the game, no amount of government spending will translate to an increase in the standard of living (real GDP per capita).

The nonlinear decline continues.

10/10

More from Society

global health policy in 2020 has centered around NPI's (non-pharmaceutical interventions) like distancing, masks, school closures

these have been sold as a way to stop infection as though this were science.

this was never true and that fact was known and knowable.

let's look.


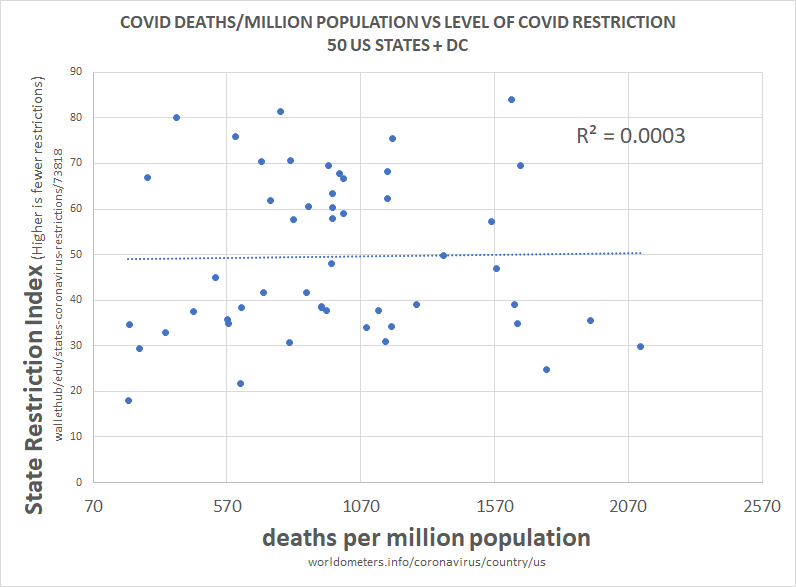
above is the plot of social restriction and NPI vs total death per million. there is 0 R2. this means that the variables play no role in explaining one another.

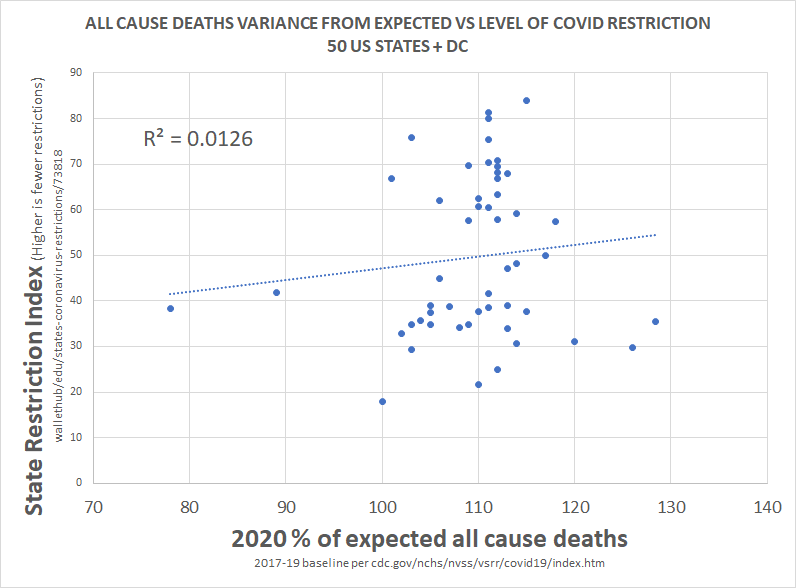
we can see this same relationship between NPI and all cause deaths.

this is devastating to the case for NPI.


clearly, correlation is not proof of causality, but a total lack of correlation IS proof that there was no material causality.

barring massive and implausible coincidence, it's essentially impossible to cause something and not correlate to it, especially 51 times.

this would seem to pose some very serious questions for those claiming that lockdowns work, those basing policy upon them, and those claiming this is the side of science.

there is no science here nor any data. this is the febrile imaginings of discredited modelers.

this has been clear and obvious from all over the world since the beginning and had been proven so clearly by may that it's hard to imagine anyone who is actually conversant with the data still believing in these responses.

everyone got the same R

You May Also Like