
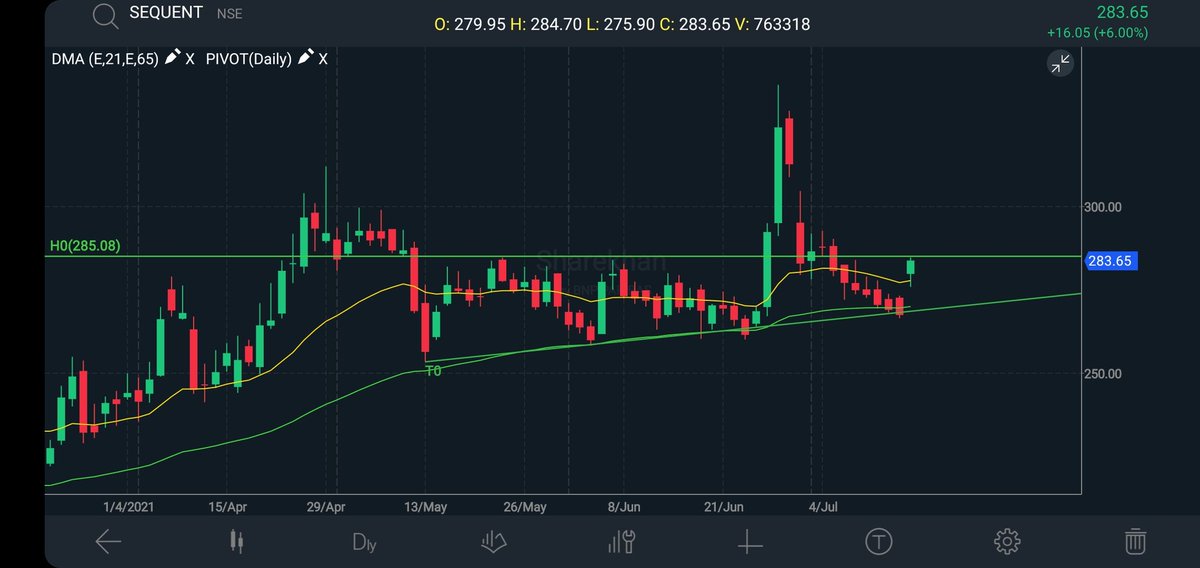
#sequent
Positional trade
Stock is back in the Triangle
Breakout above 285 levels
We may see 320/340 levels
Positional targets are for 500+ in next 6 months
@drprashantmish6
@unseenvalue
@soicfinance
More from The Man Who Never Shorts 🌟

More from Sequent


Cause everyone wanted to buy it at 300+ and no one wants to buy it at 200
Market is short sighted and loves to buy high and sell low
Sequent is a long gestation stock, it won't deliver it's real earnings until FY23-25
Not suitable investment for those who want 100% return/yr
https://t.co/7ytUeSd7gg
Market is short sighted and loves to buy high and sell low
Sequent is a long gestation stock, it won't deliver it's real earnings until FY23-25
Not suitable investment for those who want 100% return/yr
@itsTarH hey Tariq, any idea why is Sequent falling?
— Vivek (@pa_stock) September 27, 2021
https://t.co/7ytUeSd7gg
Don't expect the earnings to go anywhere till FY23.
— Tar \u26a1 (@itsTarH) August 10, 2021
Real growth will only come post FY24.
I expect the stock to either correct or stay muted till then. https://t.co/lUQfzxojTO


Sequent will teach many people about what Hyperbolic Discounting and Myopic Loss aversion means. 2 Mental models which an equity investor has to understand about. No other way. Disc: invested, not a reco
Having multiple facilities accredited with certifications from the best authorities from globe is a hidden moat in itself... 10-20% pop and then retracement should not shake confidence... Business focus and longevity should build conviction
— Harinder S Nanda (@harindersnanda) July 14, 2021
\U0001f436\U0001f431\U0001f434\U0001f42e\U0001f437\U0001f411@unseenvalue @soicfinance
You May Also Like


So friends here is the thread on the recommended pathway for new entrants in the stock market.
Here I will share what I believe are essentials for anybody who is interested in stock markets and the resources to learn them, its from my experience and by no means exhaustive..
First the very basic : The Dow theory, Everybody must have basic understanding of it and must learn to observe High Highs, Higher Lows, Lower Highs and Lowers lows on charts and their
Even those who are more inclined towards fundamental side can also benefit from Dow theory, as it can hint start & end of Bull/Bear runs thereby indication entry and exits.

Next basic is Wyckoff's Theory. It tells how accumulation and distribution happens with regularity and how the market actually
Dow theory is old but
Here I will share what I believe are essentials for anybody who is interested in stock markets and the resources to learn them, its from my experience and by no means exhaustive..
First the very basic : The Dow theory, Everybody must have basic understanding of it and must learn to observe High Highs, Higher Lows, Lower Highs and Lowers lows on charts and their
Even those who are more inclined towards fundamental side can also benefit from Dow theory, as it can hint start & end of Bull/Bear runs thereby indication entry and exits.
Next basic is Wyckoff's Theory. It tells how accumulation and distribution happens with regularity and how the market actually
Dow theory is old but
Old is Gold....
— Professor (@DillikiBiili) January 23, 2020
this Bharti Airtel chart is a true copy of the Wyckoff Pattern propounded in 1931....... pic.twitter.com/tQ1PNebq7d


