⦿ Books to learn about Pocket Pivots:-
‣ Trade Like an O'Neil Disciple
‣ In The Trading Cockpit with the O'Neil Disciples
⦿ YouTube Channel:-
‣ https://t.co/CHsc0TyUNk
This YouTube is a 𝐆𝐎𝐋𝐃𝐌𝐈𝐍𝐄 for Pocket Pivot & VoSI methods.
More from Ravi Sharma
1) Volatility, Volume & daily range compression scanner
2) Punch-Drunk-Love
3) GE Ratio - to track fundamentally strong stocks
4) Recently created one to track Power Play setups.
I get around 150-200 stocks daily & choose the ones with the most potential.
Sir, How do u find a set up - Do you track chart of each stock daily ? Or do u have filters , that lead you to a number of stocks , after which you scan them.
— AKASH GUPTA (@lockdownmurti) August 25, 2021
1) 50 WMA > 100 WMA > 150 WMA > 200 WMA
2) Price is within 25% range of its 52-Week High and above 30% or more from its 52-Week Low.
Just one question , how do u differentiate stage 2 from 1 , apart from volume , what else do u look ?
— Priyanshu (@Priyans48107837) August 6, 2021

More from Screeners


BTW Nifty Metal has inverse correlation with USDINR. https://t.co/X6cqVcYF3V
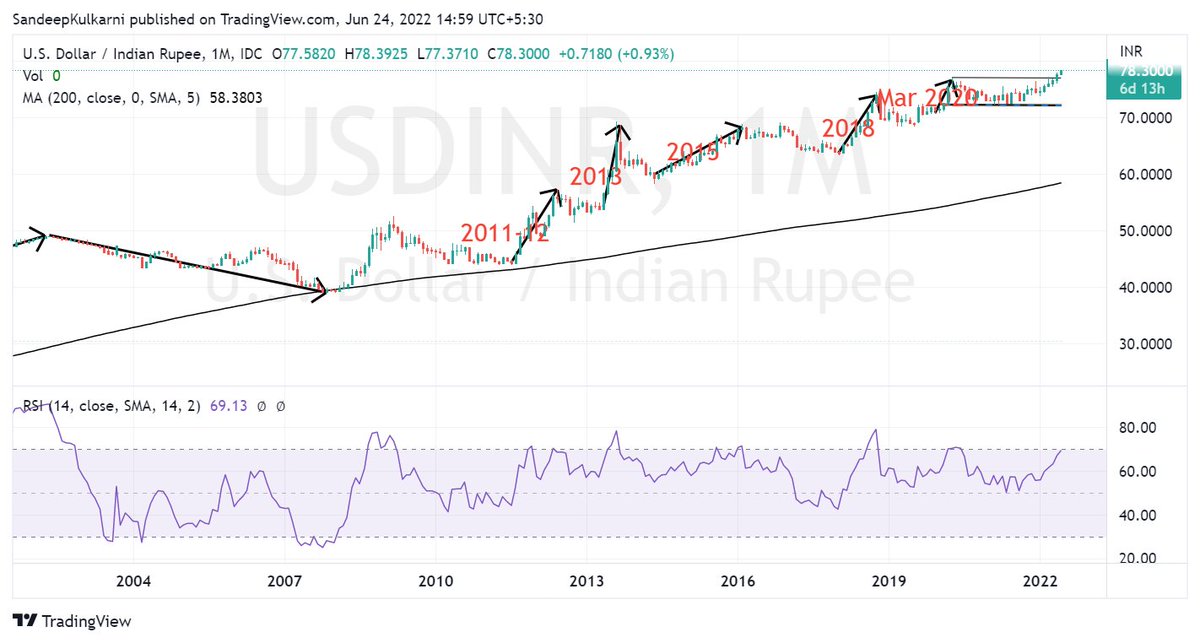
We know how our stock market has weathered the FII selling.
— Sandeep Kulkarni (@moneyworks4u_fa) June 10, 2022
But the equally big story is how Rupee has weathered $50bn+ outflows since Oct 2021. Hats off to RBI Governor Das & his team for having the vision of building huge reserves in his tenure. pic.twitter.com/CVuF9dM361

You May Also Like


I'll begin with the ancient history ... and it goes way back. Because modern humans - and before that, the ancestors of humans - almost certainly originated in Ethiopia. 🇪🇹 (sub-thread):
The famous \u201cLucy\u201d, an early ancestor of modern humans (Australopithecus) that lived 3.2 million years ago, and was discovered in 1974 in Ethiopia, displayed in the national museum in Addis Ababa \U0001f1ea\U0001f1f9 pic.twitter.com/N3oWqk1SW2
— Patrick Chovanec (@prchovanec) November 9, 2018
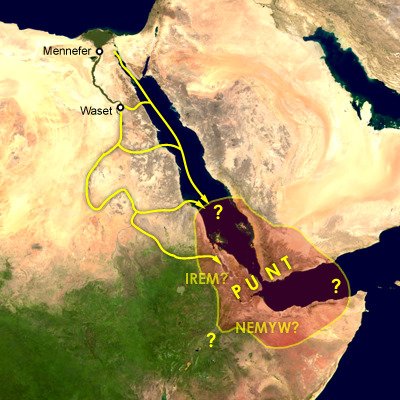
The first likely historical reference to Ethiopia is ancient Egyptian records of trade expeditions to the "Land of Punt" in search of gold, ebony, ivory, incense, and wild animals, starting in c 2500 BC 🇪🇹
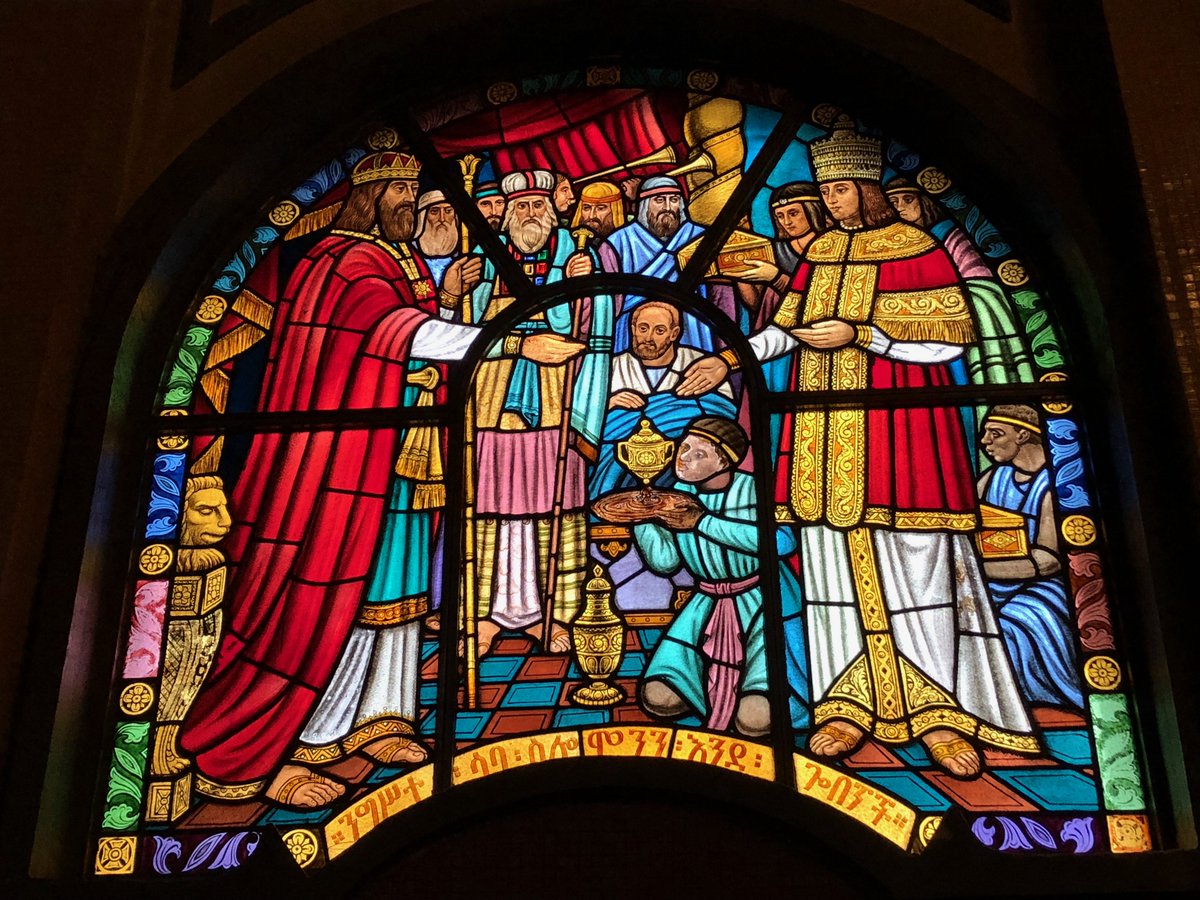
Ethiopians themselves believe that the Queen of Sheba, who visited Israel's King Solomon in the Bible (c 950 BC), came from Ethiopia (not Yemen, as others believe). Here she is meeting Solomon in a stain-glassed window in Addis Ababa's Holy Trinity Church. 🇪🇹
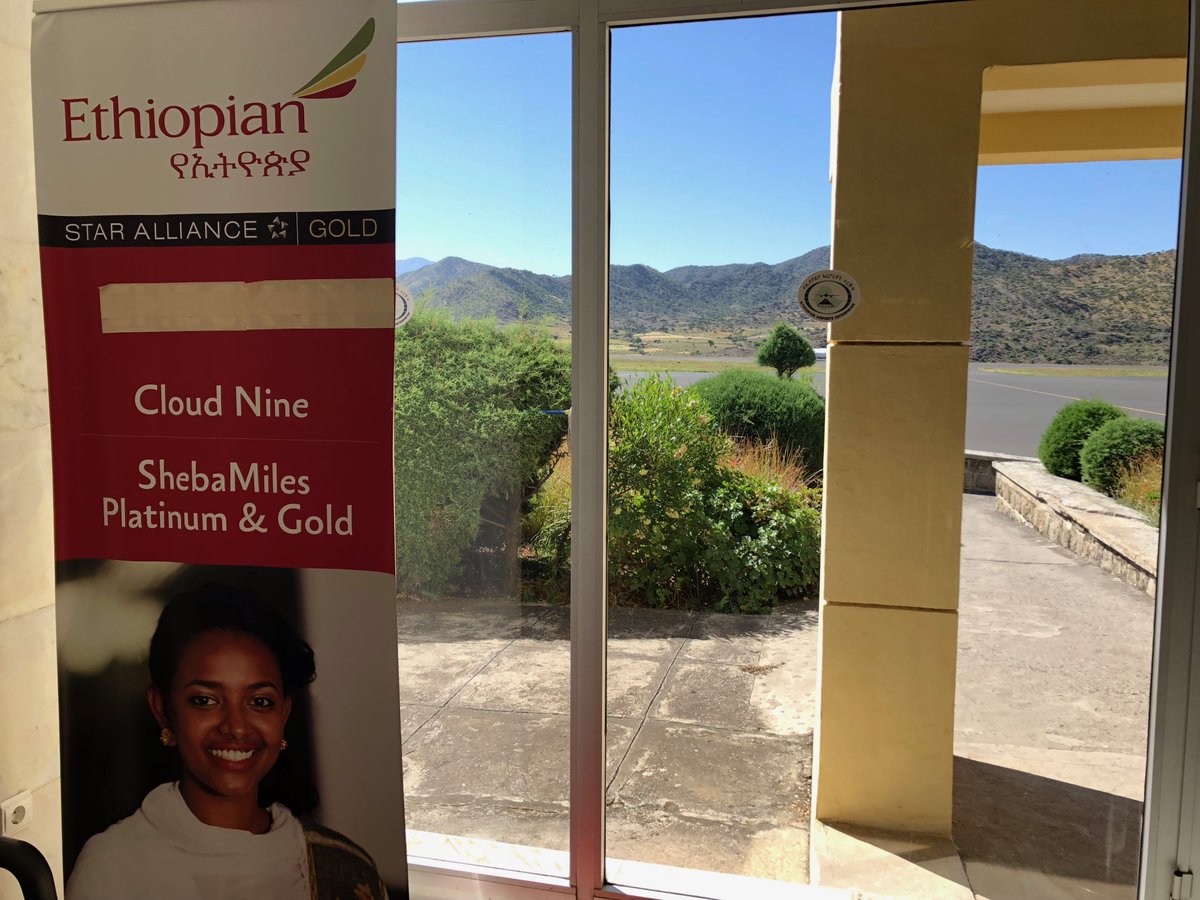
References to the Queen of Sheba are everywhere in Ethiopia. The national airline's frequent flier miles are even called "ShebaMiles". 🇪🇹