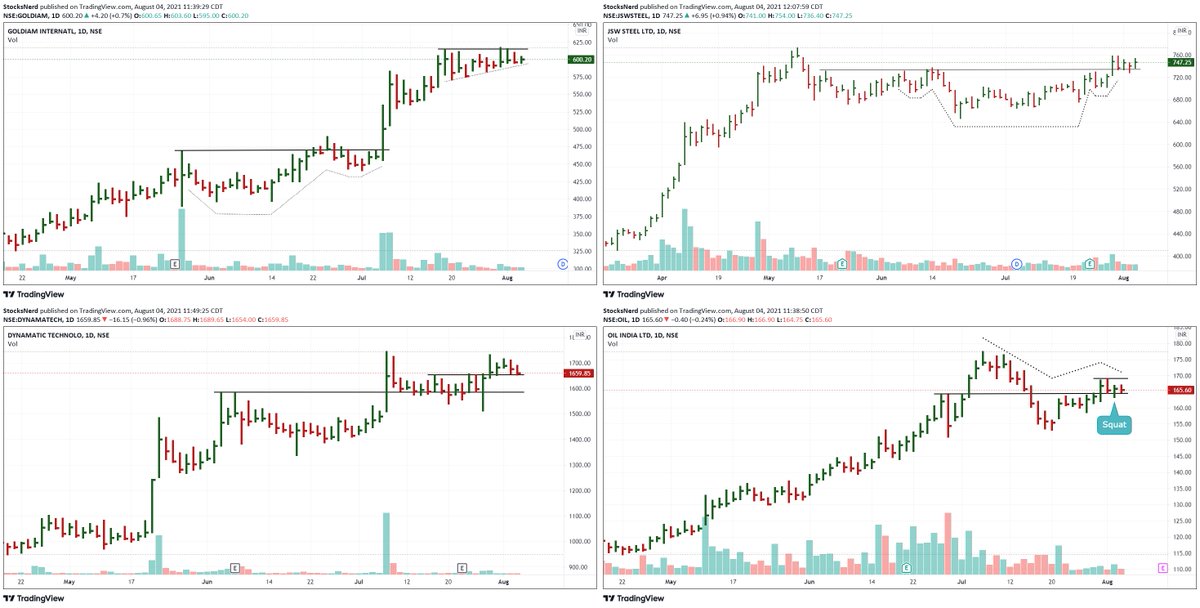
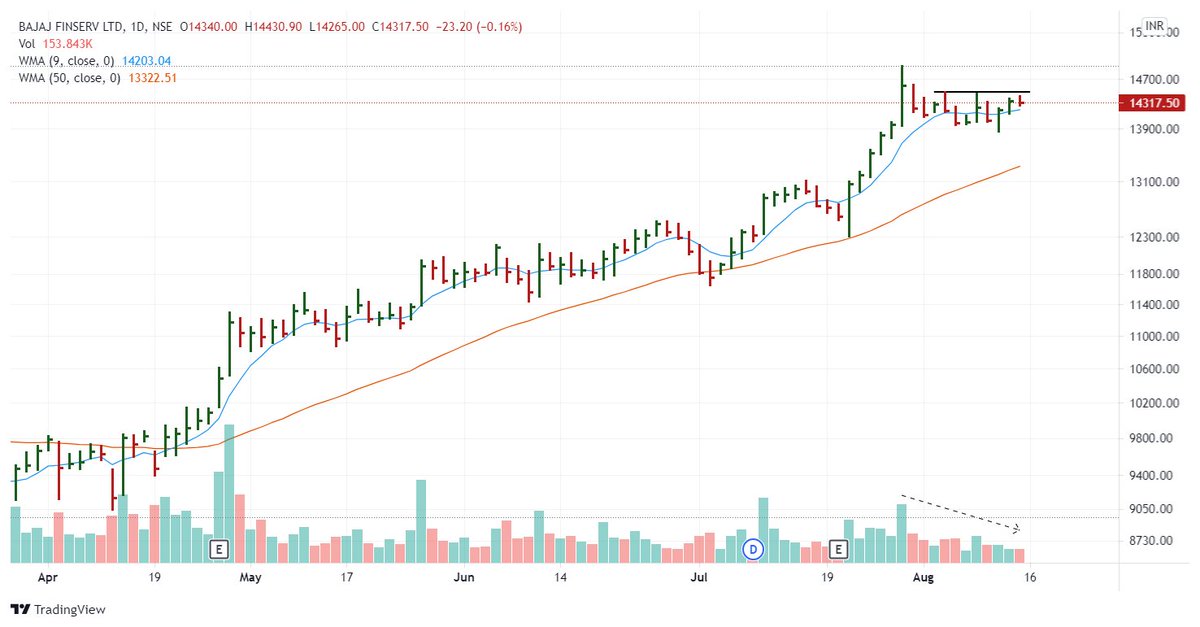
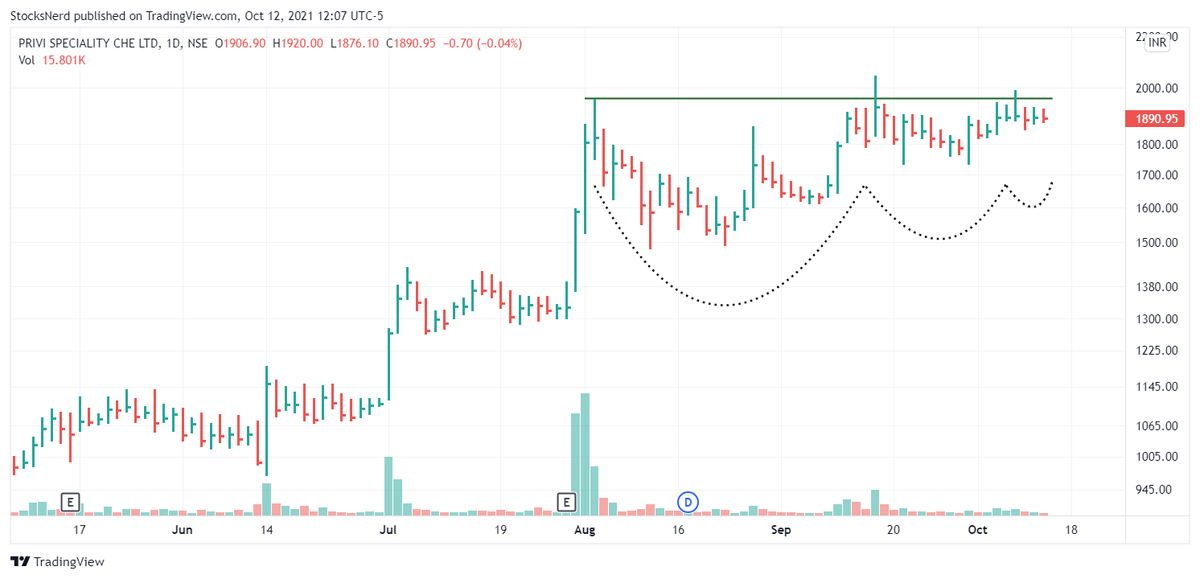
Focusing on the stocks that are holding well with contraction in daily range, volatility & Volume.
#GOLDIAM
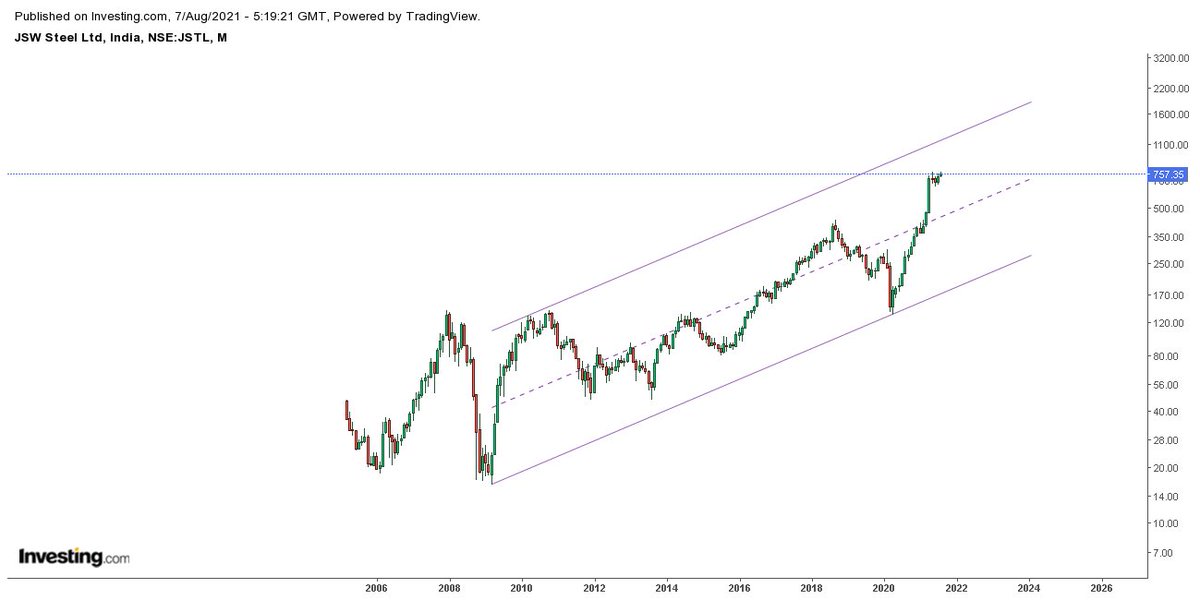
#JSWSTEEL
#DYNAMATECH
#OIL
More from Ravi Sharma
I have been asked a lot about how to determine the direction of the broader market.
I have made some minor tweakings to this timing model since this tweet but it still will give you an idea and primer 👇
I have made some minor tweakings to this timing model since this tweet but it still will give you an idea and primer 👇
Trading 101 with SmallCap Index
— Ravi Sharma (@StocksNerd) August 20, 2019
1. Swing trades when bullish divergence in MACD-H forms
2. Breakout trades if Index closes above 22-Day high
3. Pullback/Pocket Pivot trades if Index consolidates constructively while13-EMA>22-EMA
4. Sell, go cash if Index breaches 10-Day low, NQA pic.twitter.com/u8VjXrU0Re
I use 4 scanners:
1) Volatility, Volume & daily range compression scanner
2) Punch-Drunk-Love
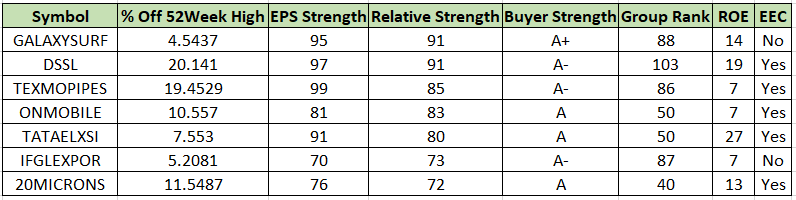
3) GE Ratio - to track fundamentally strong stocks
4) Recently created one to track Power Play setups.
I get around 150-200 stocks daily & choose the ones with the most potential.
1) Volatility, Volume & daily range compression scanner
2) Punch-Drunk-Love
3) GE Ratio - to track fundamentally strong stocks
4) Recently created one to track Power Play setups.
I get around 150-200 stocks daily & choose the ones with the most potential.
Sir, How do u find a set up - Do you track chart of each stock daily ? Or do u have filters , that lead you to a number of stocks , after which you scan them.
— AKASH GUPTA (@lockdownmurti) August 25, 2021